Dominance Debrief #9
USDTDOM surged +6.46% to test the 7.50% regime line, closing at 7.45% after three weeks pinned below 7.35%. SOLDOM lost −5.94%, ETHDOM shed −4.41%, BTCDOM held flat at +0.17%. A quality-sort week disguised as broad risk-off.
THE DOMINANCE DEBRIEF
Week of May 11 – May 17, 2026
Issue #9
TL;DR: USDTDOM surged +6.46% to test the 7.50% regime line, closing at 7.45% after three weeks pinned below 7.35%. SOLDOM lost −5.94%, ETHDOM shed −4.41%, BTCDOM held flat at +0.17%. A quality-sort week disguised as broad risk-off.
1. THE WEEK IN DOMINANCE
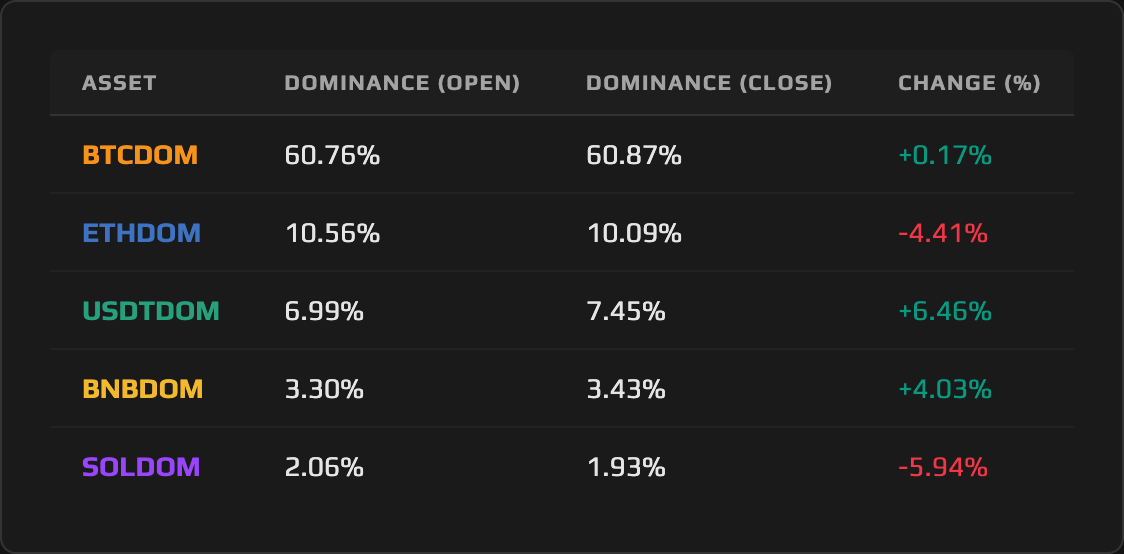
A hot CPI print, a Fed chair transition, and persistent Bitcoin ETF outflows combined to flush risk sentiment from Neutral to Fear over seven days. Tether Dominance was the week’s commanding winner, surging from 6.99% to 7.45% on close and tagging the 7.50% regime line intraweek for the first push back toward it since April, while Solana Dominance and Ethereum Dominance bore the sharpest losses. BTCDOM held its footing at 60.87%, essentially flat on the week, and BNBDOM actually gained ground at +4.03%, standing out as the risk asset that shrugged off what others could not. The divergence between the winners and losers this week says more than the headline numbers: capital did not exit crypto uniformly; it sorted by quality.
2. MACRO CONTEXT — THE BACKDROP
The total crypto market cap contracted roughly 5.9% over the seven-day window, falling from approximately $2.68 trillion on Monday’s open to $2.53 trillion by Sunday’s close. That decline unfolded against a backdrop dominated by two scheduled events that both delivered in the hawkish direction. Tuesday’s CPI report came in above consensus on both measures: headline inflation printed +3.8% year-over-year against a 3.6% estimate, while core CPI landed at +2.8%. Energy prices, up 17.9% year-over-year against persistent US-Iran tensions, were a significant factor in the headline overshoot. The result was immediate: risk assets sold off, the Fear & Greed Index began its slide from 48 at the open to 28 by Sunday’s close, and capital started gravitating toward safety within the crypto complex.
Layered on top of the inflation data was a regime-change event in monetary policy. Friday marked the end of Jerome Powell’s tenure as Fed Chair, with Kevin Warsh confirmed and taking over. That transition added an uncertainty premium to everything rate-sensitive. Markets had already repriced against a hawkish backdrop from the prior week’s FOMC decision: the April 29 meeting produced an 8–4 vote, four dissents, and the first multi-dissent outcome since October 1992. Powell’s final meeting as chair established a holding pattern with an unmistakably hawkish tilt. Warsh inheriting that chair without a clean directional signal from the new leadership created the kind of regime ambiguity that tends to benefit stablecoins over risk assets.
Bitcoin ETF flows continued to bleed. A single-day outflow of $268.5 million on May 7 reversed a six-week streak of net inflows, with IBIT and FBTC both recording outflows during the week. That pressure on the most liquid BTC product did not materially hurt BTCDOM, because the selling appears to have come out of altcoins and higher-beta assets faster than out of Bitcoin itself. The net result was a market that wanted to stay inside crypto but grow more selective about how it did so.
3. ASSET DEEP DIVE
Tether (USDT) Dominance
Open: 6.99% / Close: 7.45% / WoW Change: +6.46%
The Structure
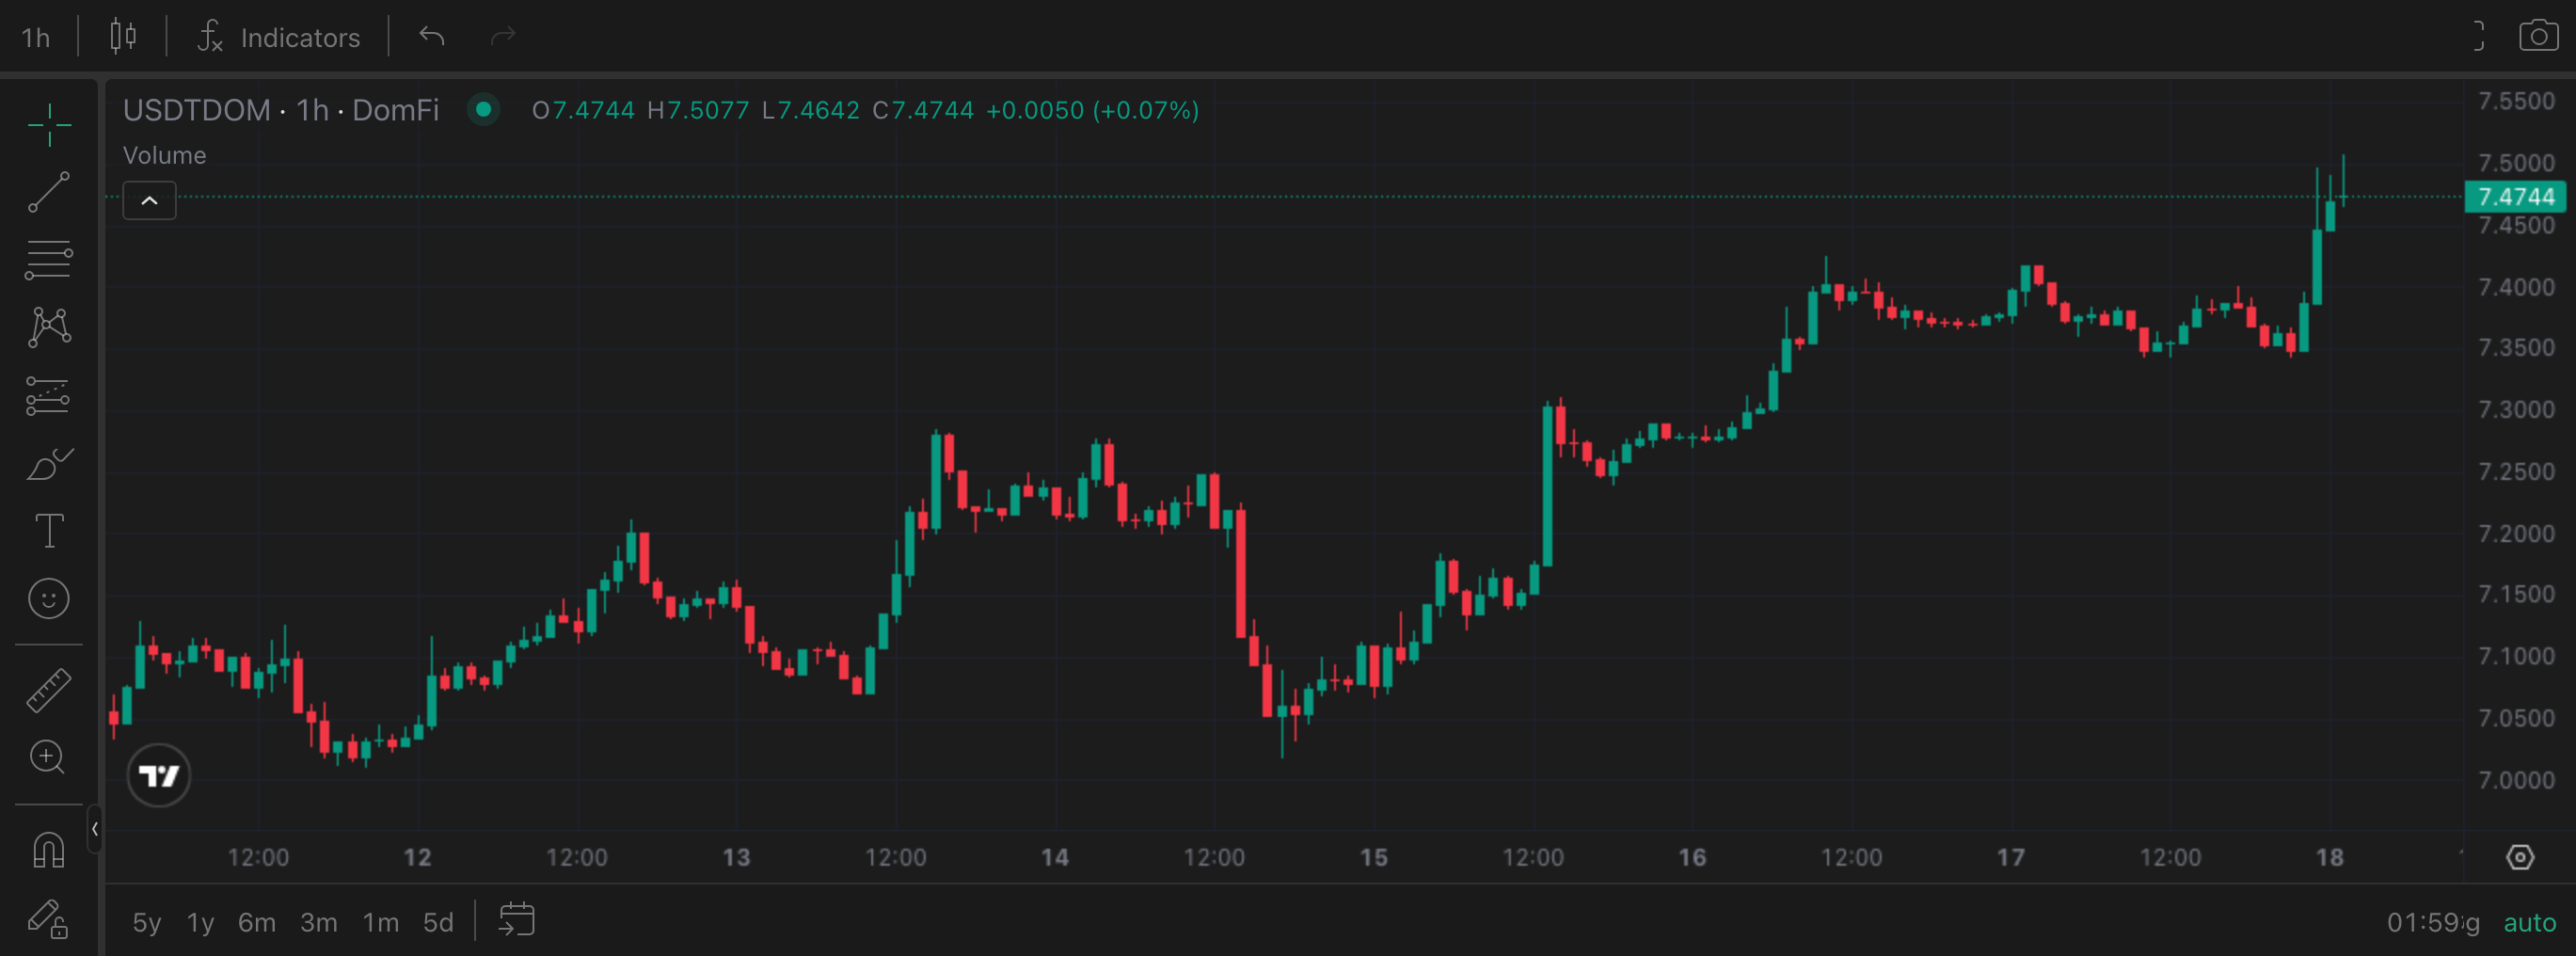
Tether Dominance entered this week carrying three weeks of suppression below the 7.35% ceiling. Three weeks ago, USDTDOM closed at 7.32%. Two weeks ago, 7.35%. Last week it slipped to 6.99% at the open of this week, a pullback that looked like distribution at the time. What followed was the decisive answer: USDTDOM surged through that ceiling, tagged an intraweek high of 7.50%, and closed the week at 7.45%, just shy of the line. The 7.50% level is the structural regime line that defined the late-April risk-on transition, and this week’s run tested it but did not take it on close. The clean read: the 7.32%–7.35% three-week ceiling has flipped to floor on a weekly closing basis, while the 7.50% reclaim is still pending. A weekly close above 7.50% would confirm the structural reversal; a close back below 7.35% would invalidate this week’s progress entirely.
This Week’s Price Action
USDT’s peg was stable throughout the week, closing at $0.9994. The dominance story is entirely about capital allocation. The aggregate stablecoin market cap, per DefiLlama, moved from $320.85 billion to $321.48 billion — essentially flat. That flatness is the key detail: USDTDOM’s +6.46% gain did not come from a wave of fresh stablecoin minting inflating the aggregate supply. The expansion was ratio-driven. As BTC fell 5.74%, ETH dropped 10.17%, and SOL declined 11.69%, the total crypto market cap shrank, and USDT’s fixed supply became a larger share of a smaller whole. The stablecoin complex held its ground; the risk complex around it contracted.
The Daily View
USDTDOM opened at 6.99% on Monday and tracked sideways into Tuesday morning before the CPI release catalyzed the move. The acceleration through the 7.32%–7.35% prior ceiling was clean, with no meaningful rejection. The intraweek tag of 7.50% arrived late in the week as sentiment continued deteriorating, the Fear & Greed Index sliding from the mid-40s into the 30s and then below 30 on Saturday. The Sunday close at 7.45% sits above the recently broken 7.35% ceiling but below the 7.50% regime line, a configuration that reads as acceptance of the smaller breakout while the larger one remains contested. The week’s swing of 7.30% (intraweek low 6.99%, high 7.50%) reflects how much ground USDTDOM covered. Momentum stayed with the bulls through the close, but the most important level on the chart was tested, not taken.
The Why
Two mechanisms drove Tether Dominance higher simultaneously. The first: risk asset prices fell sharply across the board, contracting the total crypto market cap and lifting USDTDOM off the floor as a larger slice of a smaller whole. The second: USDT held its position within a flat stablecoin aggregate. With the total stablecoin market cap barely changing ($320.85B to $321.48B), USDT did not gain from competitors losing share in any dramatic way this week; it simply preserved its allocation while the risk portion of the market deflated around it. Capital that moved out of ETH and SOL landed in either USDT or exited entirely, and the dominance data shows the stablecoin slice absorbing that pressure. Add the CPI shock as the initial catalyst, the Powell-to-Warsh regime transition as the overhang, and the ETF outflow backdrop as the structural drip, and the chain from catalyst to flow to dominance outcome is unambiguous.
The Outlook
The binary for Tether Dominance next week hinges on Wednesday’s FOMC Minutes. The April 29 meeting produced four dissents and Powell’s last statement as chair; the minutes will reveal the texture of that dissent and any forward guidance language the headline vote obscured. If the minutes read more hawkish than the market expects, USDTDOM has a clear path through 7.50% on close and into the 7.65%–7.80% band, as rate-sensitive risk positioning gets unwound further. If the minutes contain any signal that the new Warsh leadership is leaning toward a June cut setup, USDTDOM could fail back below 7.32% quickly and surrender this week’s gains in a single session. Stablecoin-to-risk rotations are fast and they do not wait. The 7.32%–7.35% zone is now the structural floor; a weekly close below it would be the first signal that the risk-on regime is reasserting.
4. THE DOMINANCE MATRIX
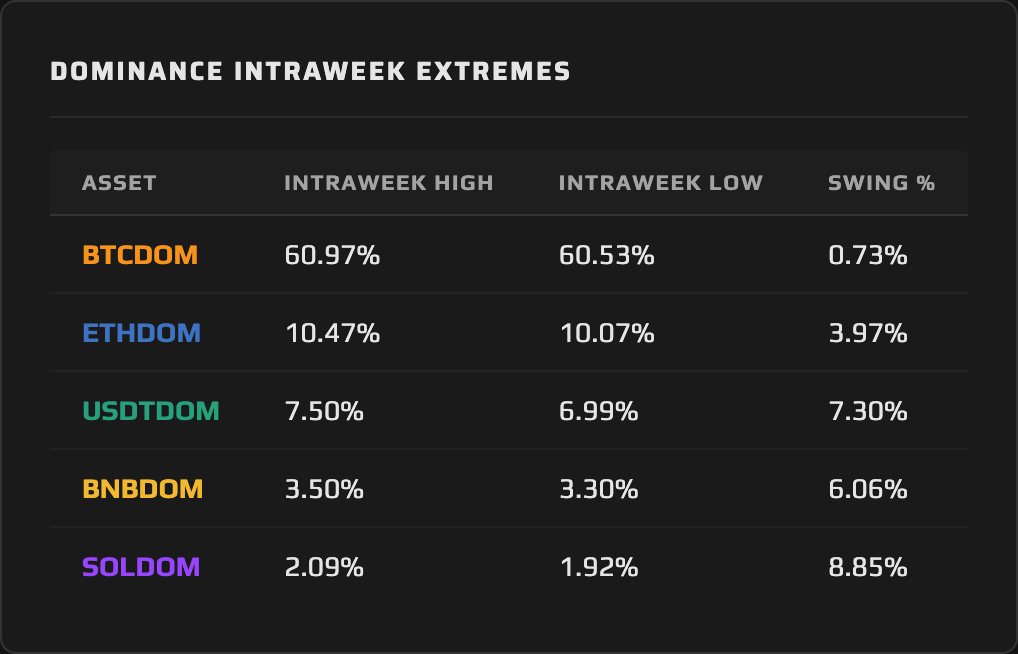
The four remaining dominance pairs this week split into a cluster structure worth examining precisely because the clusters cut across narrative lines. BTCDOM and BNBDOM both finished the week in positive territory; ETHDOM and Solana Dominance both bled. That alignment is not what a standard risk-off week produces. In a pure flight-to-safety, every risk asset loses dominance. This week, two of them gained it.
BNBDOM was the outlier. A gain of +4.03%, moving from 3.30% to 3.43%, is a result that demands an explanation when ETH and SOL were being marked down aggressively. BNB fell just 2.20% in price terms, far less than the 10–11% drawdowns that hit ETH and SOL. BNB’s exchange-utility floor provided a structural bid that more speculative assets did not enjoy. When capital rotates out of beta, it tends to exit the highest-beta positions first. BNB, anchored by Binance’s trading volume and ecosystem fees, behaved more like a cash-flow asset than a speculative one this week. BNBDOM’s intraweek high of 3.50% and its 6.06% swing confirm that the move was not passive; buyers were present.
Bitcoin Dominance closed essentially unchanged at +0.17%, from 60.76% to 60.87%. In a week where BTC’s price fell 5.74%, that flat dominance read is its own signal. Capital sold altcoins harder than it sold BTC; the ETF outflow dynamic concentrated selling in the most liquid product (BTC-denominated instruments) while the underlying BTC dominance held its share. BTCDOM traded in a 0.73% intraweek range (low 60.53%, high 60.97%), the tightest range among all pairs this week, which reflects the gravitational stability BTC’s position carries even in drawdown conditions. The 60% floor held with room to spare.
Ethereum Dominance dropped −4.41%, from 10.56% to 10.09%, with an intraweek low of 10.07%. That low is meaningful: 10.07% represents the narrowest margin above the 10.00% round level ETHDOM has seen in recent weeks. ETH’s price decline of 10.17% effectively erased all the April rally gains, and the dominance data confirms that ETH is losing share both to Bitcoin and to stablecoins simultaneously. ETHDOM’s intraweek high was only 10.47%, suggesting no meaningful buyer defense above 10.40–10.50%. The range is compressing downward.
Solana Dominance was the week’s hardest loser at −5.94%, falling from 2.06% to 1.93%, with an intraweek low of 1.92%. The Alpenglow consensus upgrade going live on community validator testnet on Monday briefly sparked a bid: SOLDOM touched 2.09% intraweek as the narrative absorbed one of the most consequential consensus changes in Solana’s history, compressing block finality from ~12 seconds to ~150 milliseconds. That bid did not survive contact with CPI Tuesday. SOL’s 11.69% price decline crushed the upgrade premium entirely, and SOLDOM finished below its opening level by a wider margin than any other pair. The intraweek swing of 8.85% is the largest in the matrix by a significant distance. Solana Dominance closed decisively below 2.00%, losing the round-number level it had defended in recent issues.
Synthesis: This was a quality-sort week disguised as broad risk-off. The market still wants crypto exposure; it is now picky about which crypto.
5. THE WEEK AHEAD — EVENTS CALENDAR
Wednesday, May 20 — FOMC Minutes (April 29 meeting; 8–4 vote, four dissents, Powell’s final meeting as Fed Chair).
Thursday, May 21 — Initial Jobless Claims (Prior: 211K).
Friday, May 22 — Conference Board Leading Economic Index (Prior: −0.3%) | Deribit weekly BTC and ETH options expiry.
What to Watch for Dominance: The FOMC Minutes on Wednesday are the week’s binary. Hawkish dissent texture that reinforces the higher-for-longer read pushes USDTDOM toward the 7.65–7.80% zone and keeps BTCDOM pinned near current levels; a dovish surprise or any forward signal toward a June cut under Warsh sends USDTDOM back below 7.32%, unwinding the week’s structural reclaim. ETHDOM at 10.09% is one bad session away from testing 10.00%; whether that level holds or breaks will indicate whether buyers defend ETH at these dominance levels or let the slide continue.
6. CLOSING REMARK
The dominant theme of this week was regime-line challenge. Tether Dominance sitting below 7.35% for three consecutive weeks looked like consolidation. It turned out to be compression before release. The CPI shock, the Fed transition overhang, and the ETF outflow drip all converged on the same week and produced a +6.46% USDTDOM surge that lifted the metric from 6.99% to 7.45% on close, tagging the 7.50% regime line intraweek before settling just below it. Three weeks of resistance at 7.32%–7.35% became this week’s floor; the 7.50% line remains the next contest.
What separates this week from a generic risk-off signal is the quality sorting inside the risk complex. BNBDOM climbed in the same week that SOLDOM lost nearly 6%. That spread is not random. It reflects where capital went when it rotated out of the highest-beta positions: not into stablecoins alone, but into the assets with the clearest structural utility floors. Bitcoin held its share for the same reason. The dominance charts this week do not describe a market fleeing crypto. They describe a market becoming more deliberate about the crypto it holds. That distinction will matter when the rotation back into risk begins, because the assets that held dominance during the compression are the ones positioned to lead when the tide turns.
This content is produced by domination.finance for informational and educational purposes only. Nothing contained herein constitutes financial or investment advice. Always conduct your own research.