Dominance Debrief #8
SOL dominated the week. SOLDOM surged 9.64% as Alpenglow upgrade news collided with broad altcoin rotation. USDTDOM shed 4.74% as the market expanded around stationary USDT supply. Capital is coming off the sidelines.
THE DOMINANCE DEBRIEF
Week of May 4 – May 10, 2026
Issue #8
SOL dominated the week. SOLDOM surged 9.64% as Alpenglow upgrade news collided with broad altcoin rotation. USDTDOM shed 4.74% as the market expanded around stationary USDT supply. Capital is coming off the sidelines.
1. THE WEEK IN DOMINANCE
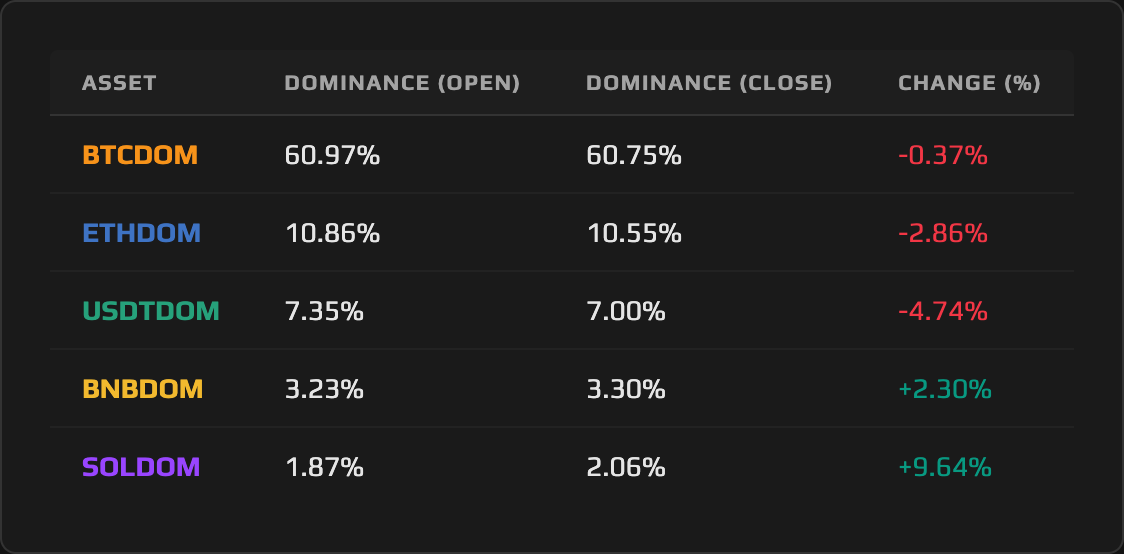
A risk-on week with a curveball buried inside it. The total crypto market cap expanded 4.98%, from roughly $2.554 trillion to $2.681 trillion, and the dominance data reflects what happens when capital deploys down the risk curve at pace: SOLDOM surged 9.64%, BNBDOM gained 2.30%, and USDTDOM shed 4.74% as USDT’s supply held essentially flat against a market that moved nearly 5% higher around it. The curveball is ETHDOM. In a week where altcoins broadly outperformed and mid-cap assets gained significant share, Ethereum Dominance declined 2.86%. Bitcoin Dominance slipped 0.37%. The week’s shape is not ambiguous: capital rotated out of stablecoins and out of ETH, bypassed BTC, and concentrated in SOL and BNB.
2. MACRO CONTEXT — THE BACKDROP
The week opened with BTC crossing $80,000 on Monday, May 4, its highest level since January. By mid-week, BTC pushed above $81,000 after Secretary of State Marco Rubio’s comments eased Middle East escalation fears, providing a risk-on catalyst that rippled through the broader complex. The Fear & Greed Index began the week at 68 (Greed) and compressed to 50 by Sunday, a retreat from euphoria toward neutrality that unfolded as the back half of the week delivered mixed signals on ETF flows.
BTC spot ETF flows tell a more textured story than the headline price gain suggests. The week opened with sustained inflow momentum: nine consecutive days of net inflows, with May 4 alone adding $532 million (IBIT $335 million, FBTC $185 million). But inflows decelerated sharply by May 6, reaching just $46 million. May 7 then reversed into outflows of $268.5 million (FBTC −$129 million, IBIT −$98 million), and the week closed with approximately $245.7 million in cumulative outflows over its second half. The net read is a week where institutional demand front-loaded the momentum and then spent the back half consolidating. Price held those gains; dominance told a subtler story.
The Fed backdrop had solidified the prior week. The April 29 FOMC held at 3.50–3.75% with an 8–4 vote split, the most dissents since October 1992, and the implicit next-move-is-a-cut signal remained in the statement despite Logan’s dissent on that language. Powell’s term as Fed chair runs through May 15; the Senate Banking Committee voted 13–11 along party lines to advance Kevin Warsh’s nomination, with a full Senate confirmation vote expected the week ahead. That transition overhang added a layer of policy uncertainty that kept macro risk squarely on the table even as crypto assets pushed higher.
3. ASSET DEEP DIVE
Solana (SOL) Dominance
Open: 1.87% / Close: 2.06% / WoW Change: +9.64%
The Structure
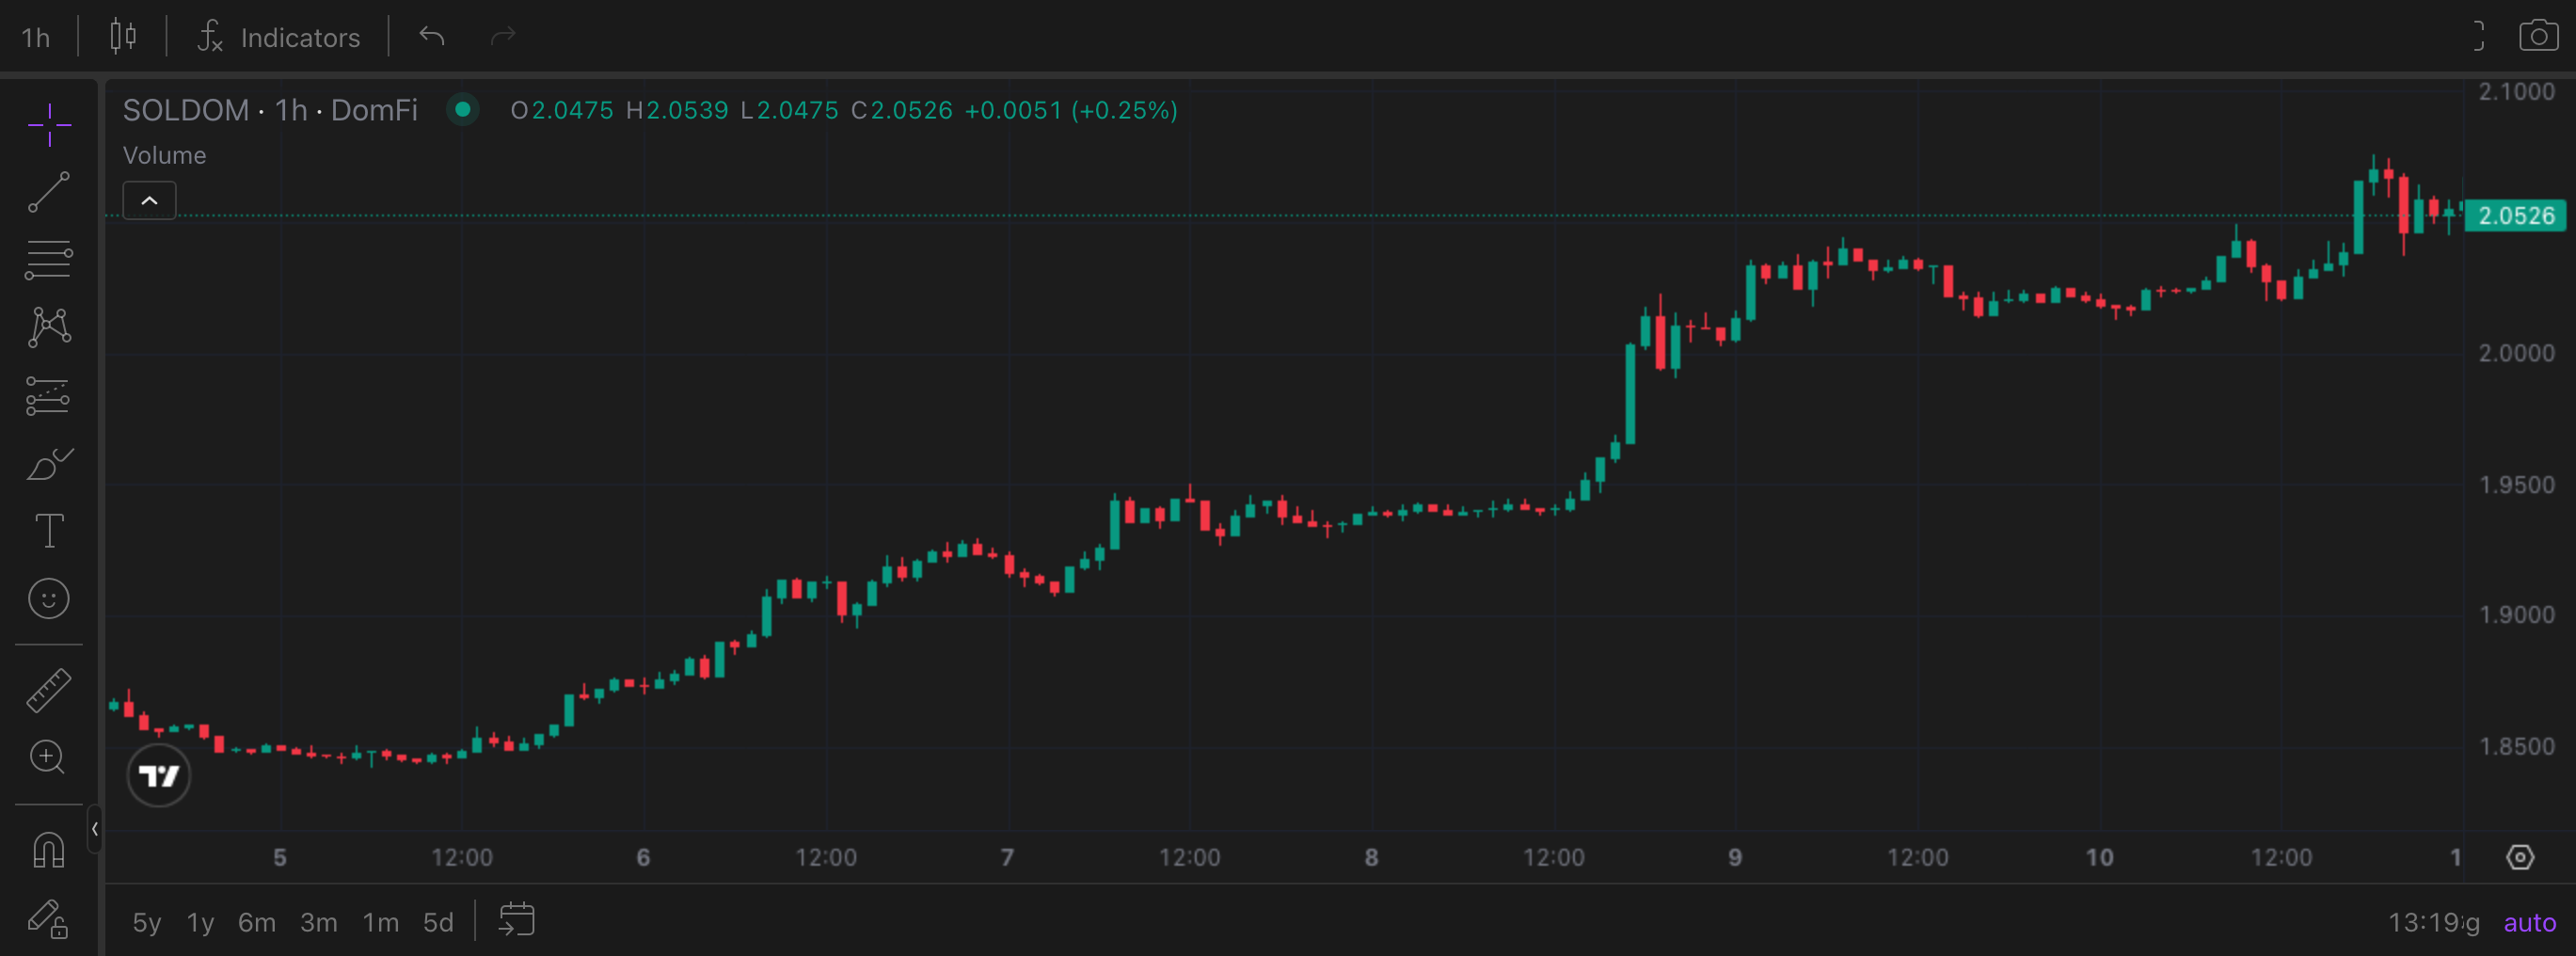
Solana Dominance entered this week at 1.87%, sitting at the lower end of the range it has occupied over the past month. The prior week’s close confirmed a support zone in the 1.85%–1.90% band, and the question heading into this week was whether that support would hold or give way under the $753 million unlock pressure the prior analysis flagged. Instead, SOLDOM broke in the other direction entirely. The 9.64% move from 1.87% to 2.06% breaks the lower-high structure that had been the prevailing pattern, with the close at 2.06% clearing the prior resistance band at 1.92%–1.96% and pressing into territory not seen in several weeks. The intraweek high of 2.08% was the week’s ceiling; a weekly close above 2.08% would confirm the breakout has extension. The 2.00% level, which SOLDOM spent most of 2026’s first quarter failing to sustain, is now the first test of whether this week’s move represents structural reclamation or a rotation-driven overextension.
This Week’s Price Action
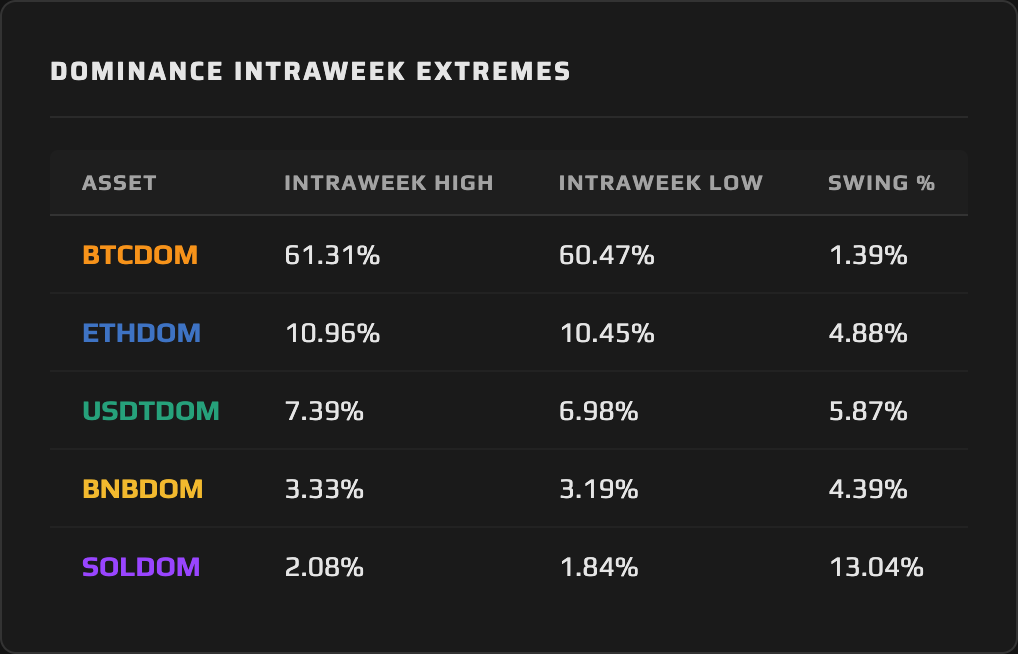
SOL gained 14.95% in price terms, from $83.89 to $96.43, the sharpest price move of any covered asset. Against a total market that expanded 4.98%, SOL’s outperformance of roughly 10% in price alone would mathematically lift SOLDOM even in a static dominance environment. But the move had two components, and separating them matters for the forward picture. The broad altcoin rotation accounts for part of the gain: capital flowing from stablecoins and ETH into mid-cap altcoins broadly lifted assets in SOL’s tier. The Alpenglow upgrade narrative accounts for the asset-specific premium on top of that. The week’s high of 2.08% was reached on or around May 5–6, when Alpenglow coverage peaked. SOL tested the $98–$100 zone by week’s end, a key level that had broken down earlier this year, but the weekly close at $96.43 did not quite clear it. The 12.72% intraweek swing in SOLDOM (from 1.84% low to 2.08% high) was the largest of any covered pair by a significant margin, reflecting real directional conviction rather than a choppy week that happened to close higher.
The Daily View
The daily structure is a steady ascent with most of the work done in the first half of the week. SOLDOM gapped higher from the Monday open and sustained the move through Thursday before consolidating in the 2.04%–2.08% range on Friday and Saturday. The absence of a sharp reversal after the initial surge is meaningful: SOLDOM absorbed the back-half deceleration in BTC ETF flows without giving up the weekly gain. The daily low of 1.84% was set at the very start of the week, confirming that Monday was the turning point. Momentum is now pointing higher for the first time since February, and the daily chart shows accumulation rather than distribution at the 2.00%–2.06% range. That said, SOLDOM has printed false starts from elevated levels before. The signal that this one is different would be a sustained close above 2.08% in the week ahead.
The Why
The SOLDOM move this week has two distinct drivers that operated in parallel, and assigning the gain to either one alone would misread the structure.
The macro layer is the rotation framework: USDTDOM shed 4.74% as USDT supply remained flat against a market expanding nearly 5%. USDT’s share shrank because the market grew around it, not because Tether issued less. That gap between a stationary stable pool and a growing market is the mechanism by which capital returns to risk. When it flows, it does not flow uniformly. Assets with the clearest near-term catalysts capture a disproportionate share of the rotation bid. SOLDOM captured the most.
The asset-specific layer is Alpenglow. Anatoly Yakovenko’s May 5 comments indicated the upgrade could arrive as early as Q3 2026. The technical architecture includes two new components: Votor, which targets finality compression from roughly 12.8 seconds to approximately 150 milliseconds, and Rotor, which replaces Turbine’s relay network with staked-weight relay paths. Together they represent a genuine leap in Solana’s consensus capability if they ship on schedule. Moving validator voting off-chain to reduce congestion adds a third efficiency vector. The market priced this as a concrete roadmap with a credible timeframe, not as vague future development. SOL open interest rose approximately 6% in a single 24-hour stretch, reaching roughly 61.79 million tokens. That open interest expansion alongside rising price confirms the move had leverage support, not just spot buying. It also introduces a caveat: the Alpenglow catalyst is forward-looking. TVL on Solana is down 56% year-to-date and fee revenue has roughly halved. The upgrade has not shipped. What markets priced this week is the expectation, and expectations are reversible in a way that confirmed revenue is not.
The Outlook
From the 2.06% close, two scenarios dominate the forward read. In the base case, SOLDOM consolidates near the 2.00%–2.08% band as the Alpenglow narrative digests and the rotation bid from stablecoins moderates. CPI on Tuesday May 12 comes in near consensus (headline +0.6% m/m, core +0.3% m/m), broad risk appetite holds, and SOLDOM maintains the breakout without extending it aggressively. The 1.94%–1.96% range becomes the new support after functioning as resistance. The $102 million APT unlock on May 12 draws some altcoin liquidity, but not enough to materially redirect capital from SOL’s orbit.
In the risk scenario, CPI prints above consensus on headline (whether on energy or core services) and the rate-cut timeline compresses further. Higher-for-longer repricing hits the altcoin complex first. SOLDOM, having just posted its largest weekly gain in months on a forward-looking catalyst, would be among the more vulnerable pairs to a macro-driven reversal. A hot CPI print could push SOLDOM back toward 1.90%–1.95%, erasing a meaningful portion of this week’s move. The Alpenglow narrative would not disappear, but it would compete with a macro headwind that the prior week’s dominance data confirmed remains capable of overwhelming asset-specific stories in short order.
4. THE DOMINANCE MATRIX
The remaining four dominance pairs this week form a picture of a market in active capital reallocation. Rank them by weekly magnitude and the structure is clear: USDTDOM at −4.74%, ETHDOM at −2.86%, BNBDOM at +2.30%, BTCDOM at −0.37%. The magnitude spread is wide enough to contain three distinct mechanisms, and reading the week as a single “risk-on” rotation misses the specificity that each pair reveals.
USDTDOM is the week’s structural outlier. The 4.74% decline, from 7.35% to 7.00%, is the largest absolute dominance move among the four, and its mechanism differs from everything else on the table. USDT’s price was flat at approximately $1.00, and the aggregate stablecoin market cap grew only 0.41%, from $319.46 billion to $320.77 billion. USDT supply did not meaningfully expand. What expanded was the total crypto market, by 4.98%. Tether Dominance fell because the market grew around it: USDT’s market cap held relatively stationary while every other asset’s market cap grew, mechanically shrinking USDTDOM’s share. This is the clearest possible risk-on signal in the dominance data. Capital that was parked in the stable complex and reflected in USDTDOM’s elevated readings over the prior weeks moved into the market. The intraweek low of 6.98% and the 5.86% swing confirm the move was not a gentle drift; USDTDOM spent the bulk of the week pressing lower before briefly recovering to close at 7.00%. Alongside the aggregate stablecoin picture sits an intra-stablecoin signal: USDC has been capturing chain-native launches and institutional adoption at a faster rate than USDT through 2026: USDC grew by roughly $2 billion in Q1 while USDT contracted by roughly $3 billion. Circle’s USDC launch on Injective on May 7 extends that distribution footprint. The dominance lens applied within the stablecoin category is a story in its own right, and USDTDOM’s decline this week partially reflects that dynamic: Tether is the larger pool, but not the faster-growing one.
ETHDOM declined 2.86%, from 10.86% to 10.55%, and this is the week’s curveball. ETH gained 2.01% in price (a real gain), not a loss. But the total market gained 4.98%. When an asset’s price increases but the market grows faster, dominance falls. That is the mechanism, and it explains the close-to-close number. What it does not explain is the magnitude of the gap. BTC also lagged the market (4.59% price gain versus 4.98% market gain), but BTCDOM declined only 0.37% compared to ETHDOM’s 2.86% drop. Both assets underperformed the market; ETH underperformed by a wider margin in dominance terms. The implication is that capital rotating out of stablecoins did not flow into ETH to any significant degree. The “ETH leads early altseason” framework, where Ethereum is the first beneficiary of stablecoin-to-risk rotation, did not describe this week’s behavior. SOL and BNB captured the rotation; ETH did not. The 4.93% intraweek swing in ETHDOM reflects genuine directional pressure rather than a mean-reversion oscillation. The 10.45% intraweek low is now the level to watch: if ETHDOM tests and fails there in the week ahead, the divergence between ETH and the altcoin complex widens into something structurally significant.
BNBDOM advanced 2.30%, from 3.23% to 3.30%, as BNB gained 7.49% in price. BNB outpaced the total market’s 4.98% gain, and BNBDOM moved accordingly. The mechanism is the inverse of ETHDOM’s: BNB’s market cap grew faster than the overall complex, lifting its share. BNB’s performance this week connects to two threads: the broader mid-cap altcoin rotation that also benefited SOL, and BNB Chain’s ongoing development of its memecoin ecosystem via the Four.Meme platform, which has been systematically pulling volume that previously concentrated on Solana. The 4.50% intraweek swing in BNBDOM is the third largest among the covered pairs after SOLDOM and USDTDOM, reflecting genuine price-driven directional movement. BNBDOM now closes at 3.30%, back to the level it opened the prior week before declining 2.35%. The pair has recovered that lost ground in a single session; the question for the week ahead is whether the BNB-specific ecosystem narrative can sustain outperformance independent of the broader altcoin rotation when and if that rotation moderates.
BTCDOM declined 0.37%, from 60.97% to 60.75%, the smallest weekly move of the week in either direction. BTC gained 4.59% in price, a strong absolute return, but fell just short of the market’s 4.98% expansion, producing a fractional dominance decline. The 0.37% weekly change contrasts sharply with the prior weeks’ narrative of BTC concentration absorbing the risk-asset bid. This week, BTC held its ground but did not capture incremental share from the rotation. The ETF flow picture explains part of this: the nine-day inflow streak that helped establish BTC’s leadership role broke down mid-week, with $268.5 million in outflows on May 7 partially offsetting the front-end accumulation. BTCDOM held above 60%, which remains the line the prior weeks’ analysis established as structurally important. But the weekly candle is no longer expansion; it is consolidation at an elevated level while the altcoin complex moves around it.
Synthesis: The full dominance picture this week describes a rotation regime, not a leadership transfer. Capital exited stablecoins as USDTDOM shed ground mechanically against a market growing around stationary supply. That capital did not flow uniformly: it concentrated in SOL and BNB, bypassed ETH, and left BTC essentially unchanged in share terms. ETHDOM’s 2.86% decline in a risk-on week is the regime’s most important signal: the dominant altcoin is not leading the rotation, which means either the rotation is narrower than a cycle-wide altseason would produce, or ETH’s catalyst cycle is running behind the market. Either reading is a structurally significant observation. Until ETHDOM posts a week where it gains dominance alongside SOL and BNB, the rotation remains selective, not broad.
5. THE WEEK AHEAD — EVENTS CALENDAR
Tuesday, May 12 — April CPI at 8:30 ET (Consensus headline: +0.6% m/m, +3.7% y/y | Core: +0.3% m/m, +2.7% y/y). Aptos (APT) token unlock: approximately 11.3 million tokens (~$102 million) to foundation, community, core contributors, and investors.
Thursday, May 14 — Initial Jobless Claims (Prior: ~214K). PPI release expected (prior-month sequencing after CPI; no consensus figure confirmed).
Friday, May 15 — Powell’s term as Fed chair officially ends. Kevin Warsh’s Senate confirmation vote expected this week (timing fluid; may fall Monday through Wednesday).
Saturday, May 16 — Arbitrum (ARB) token unlock to DAO Treasury.
What to Watch for Dominance: CPI on Tuesday is the week’s binary. A print above consensus on headline or core reverses the easing-bias that has been quietly supporting the altcoin rotation, most directly threatening SOLDOM and BNBDOM, which this week’s move has elevated to levels that assume continued risk appetite. A soft print confirms the rotation and opens the path for SOLDOM to press above 2.08% and USDTDOM to test the 6.80%–6.90% range. The Powell-to-Warsh transition on Friday is a second variable: the market has been pricing continuity given the committee’s existing composition, but any signal from Warsh on his rate philosophy in confirmation hearings could shift Fed expectations at the margin. The APT unlock on Tuesday adds altcoin supply pressure in the same session as CPI — the combination of macro uncertainty and token supply hitting simultaneously makes Tuesday the most loaded single day for dominance in the week ahead.
6. CLOSING REMARK
The dominance data this week delivered a rotation signature: stablecoins gave ground, SOL and BNB gained, and ETH was conspicuously absent from the beneficiary list. Solana Dominance’s 9.64% weekly move is the clearest directional signal the dominance charts have produced in months, driven by the collision of a genuine technical catalyst in Alpenglow and a macro environment that had capital looking for a reason to leave the sidelines. Both conditions were present simultaneously, and the result was SOLDOM’s largest weekly gain since this publication’s coverage began.
The more important signal is ETHDOM’s 2.86% decline in the same week. Ethereum is the market’s largest altcoin. In prior altcoin cycles, Ethereum Dominance tends to move first and fastest when stablecoin capital deploys into risk. This week, it moved not at all in the right direction. That divergence between where capital went (SOL, BNB) and where the traditional rotation framework predicted it would go (ETH first, then the rest) is the structural story that CPI and the Warsh confirmation will either accelerate or arrest. If the easing cycle gains confidence and a true broad altseason develops, ETHDOM’s absence from this week’s gains becomes a coiled spring. If macro uncertainty keeps the rotation selective, SOLDOM’s Alpenglow premium becomes the first thing to fade. The dominance charts will price that outcome before anything else does.
This content is produced by domination.finance for informational and educational purposes only. Nothing contained herein constitutes financial or investment advice. Always conduct your own research.