Dominance Debrief #10
BNBDOM posted back-to-back weekly gains (+1.38%) while ETHDOM tagged 9.85% and held above 10.00% on close. USDTDOM tested 7.69% Saturday, then gave it all back. The quiet tape hid a loaded micro-structure.
THE DOMINANCE DEBRIEF
Week of May 18 – May 24, 2026
Issue #10
TL;DR: BNBDOM posted back-to-back weekly gains (+1.38%) while ETHDOM tagged 9.85% and held above 10.00% on close. USDTDOM tested 7.69% Saturday, then gave it all back. The quiet tape hid a loaded micro-structure.
1. THE WEEK IN DOMINANCE
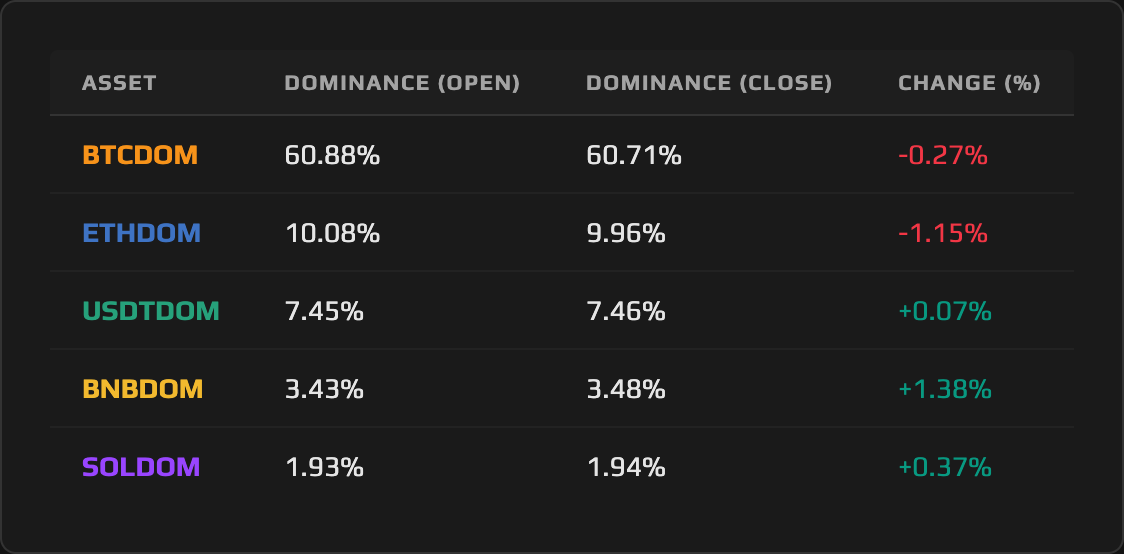
The headline numbers look calm. Nothing moved more than 1.38% in absolute terms. But underneath that compression, three distinct dominance stories were running simultaneously: BNB extended a two-week structural bid that no other risk asset matched, the risk-off thesis made one sharp Saturday-morning attempt to reclaim last week’s high before collapsing in the same session, and Ethereum Dominance defended a key level on close after testing below it intraweek. A tight week in open-to-close terms is not always a dull one.
2. MACRO CONTEXT — THE BACKDROP
The total crypto market cap moved roughly sideways over the seven-day window, opening near $2.53 trillion and closing in the same neighborhood as the broad selloff that hit late in the week offset earlier strength. That flatness on aggregate masked a divergence at the asset level: BNB gained in USD price while BTC and ETH both slipped, a dispersion that showed up clearly in the dominance charts. The stablecoin complex held at approximately $321.2 billion by the close of the period, effectively flat from the $321.5 billion reading at the open. Fresh minting was absent. The USDTDOM moves this week were ratio-driven, not supply-driven.
The week’s macro centerpiece arrived Wednesday, May 20: the FOMC minutes from the April 28–29 meeting. The readout confirmed the hawkish picture telegraphed by last week’s 8–4 vote. A majority of participants indicated that policy firming would likely become appropriate if inflation continued running above 2%; four dissents were documented (one dove wanting cuts, three hawks pushing to drop the easing-bias language entirely). Markets absorbed it without drama. The move had been priced since the April meeting’s four dissents were announced. Bitcoin held near $77,400, the Nasdaq gained 1.3%, bond yields dipped. Post-event consolidation, not new directional pressure.
The more persistent pressure came from ETF flows. A $448 million single-day outflow from IBIT on May 18 (the second-largest single-day redemption of 2026) set the tone. By week-end, ARKB had seen $324 million in cumulative outflows, IBIT $317 million, FBTC $259 million. Despite that institutional selling, BTCDOM closed down just 0.27%. When Bitcoin Dominance holds through a week of nearly $900 million in cumulative ETF outflows, the altcoin complex is absorbing more pain than the headline asset.
3. ASSET DEEP DIVE
BNB (BNBDOM) Dominance
Open: 3.43% / Close: 3.48% / WoW Change: +1.38%
The Structure
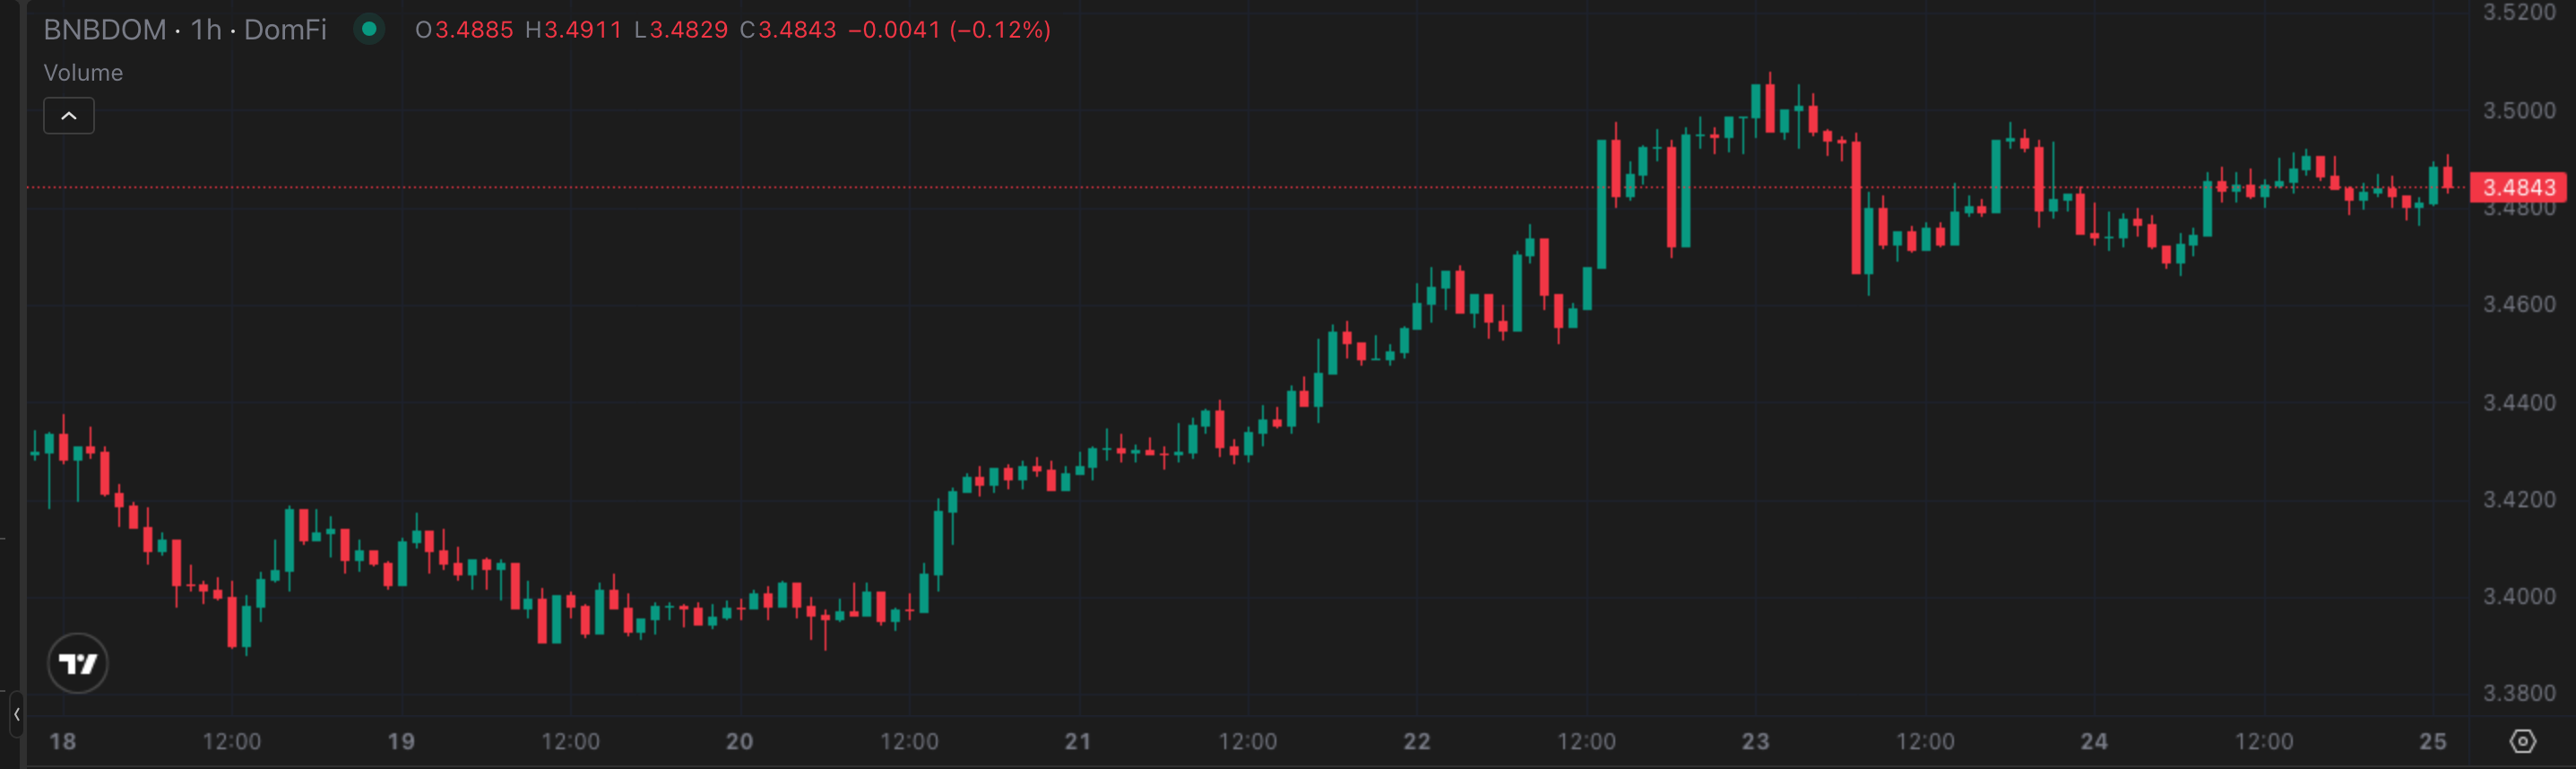
BNB Dominance has now posted back-to-back weekly gains. BNBDOM opened this week at 3.43%, already a multi-week high, and extended that position to 3.48% on close. The prevailing structure has shifted from the ranging pattern of prior weeks into a higher-low, higher-high sequence: BNBDOM closed 3.30% two weeks ago, then 3.43%, now 3.48%. Three consecutive higher closes. The 3.51% intraweek high printed Saturday represents the top of the tested range; a weekly close through that level would put BNBDOM at territory it has not held on close recently.
This Week’s Price Action
The weekly candle for BNB Dominance opened at 3.43% and spent the early part of the week building slowly, with Monday’s close at 3.40% briefly dipping before the bid re-emerged. From Tuesday onward the trend was constructive: 3.40%, 3.43%, 3.46%, 3.50%, 3.48%, 3.48%. The intraweek high of 3.51% arrived in the early hours of Saturday. The closing sequence from Friday to Sunday (3.50%, 3.48%, 3.48%) represents a soft consolidation at the high end of the week’s range, not a rejection. BNB’s price finished at $656.07, up 1.10% from the $648.95 Monday open, making it the only major asset in this report to close higher in USD terms for the week.
The Daily View
The daily chart tells a story of steady accumulation, no dramatic single-day surge. The first two days marked time near 3.40%, then each subsequent daily close stepped higher: 3.43% Wednesday, 3.46% Thursday, 3.50% Friday. The move was systematic in a way that suggests structural buying rather than speculative repositioning. Thursday’s close at 3.46% came after the FOMC minutes were digested without incident, removing the week’s largest event risk without a negative surprise. From there BNBDOM walked to its weekly closing range.
The Why
Two mechanisms drove BNB Dominance higher this week, and they operated simultaneously. BNB’s price climbed 1.10% while BTC fell 0.58% and ETH dropped 1.41%. That divergence in underlying price performance is the first factor: BNB’s market cap expanded while its competitors’ market caps shrank or stayed flat, lifting its share of the total. The second factor is the aggregate context: with the broad complex essentially flat and stablecoin supply unchanged, any asset that gains in absolute USD price while the total holds still gains dominance mechanically. BNB did both.
The structural catalyst layering on top of the price dynamic is harder to quantify but real. Grayscale and VanEck have both updated their SEC registration documents for spot BNB ETFs, representing a growing institutional access pathway that did not exist a year ago. That is a forward-looking catalyst, not an event that moved BNB this week in isolation, but it establishes a bid context that suppresses the reflexive selling that hits assets with no institutional product pipeline. BNB Chain’s technical momentum provides additional backdrop: the Fermi hardfork in January compressed block time to 0.45 seconds, and the Osaka/Mendel hardfork in late April delivered ecosystem improvements across nine BEPs. That throughput narrative makes the ETF thesis coherent to allocators evaluating BNB against Ethereum and Solana. In the same tape where ETH and SOL were being marked down and ETF outflows were hitting BTC, BNB held and extended. Capital rotating out of higher-beta positions landed somewhere, and the dominance data shows a portion of it found BNB.
The Outlook
The bull case centers on the Deribit monthly expiry Friday. Max pain sits at $75,000 (roughly $2,000 below current spot), with the $75K put strike carrying $394 million notional and the call wall at $80K ($532 million notional). If BTC gets pinned toward max pain through the week, BNBDOM benefits on a relative basis if BNB holds its absolute price level. A BTC fade toward $75K without a corresponding BNB decline would push BNBDOM above 3.51%.
The bear case is a hotter-than-expected PCE on Friday. A hot print reignites the higher-for-longer narrative, triggers a broad risk-off flush, and puts pressure on every risk asset. The question then is whether BNBDOM holds 3.43%, last week’s close, as support. Two consecutive closes at or above that level represent the new support base; a close below it would invalidate the current structure.
4. THE DOMINANCE MATRIX
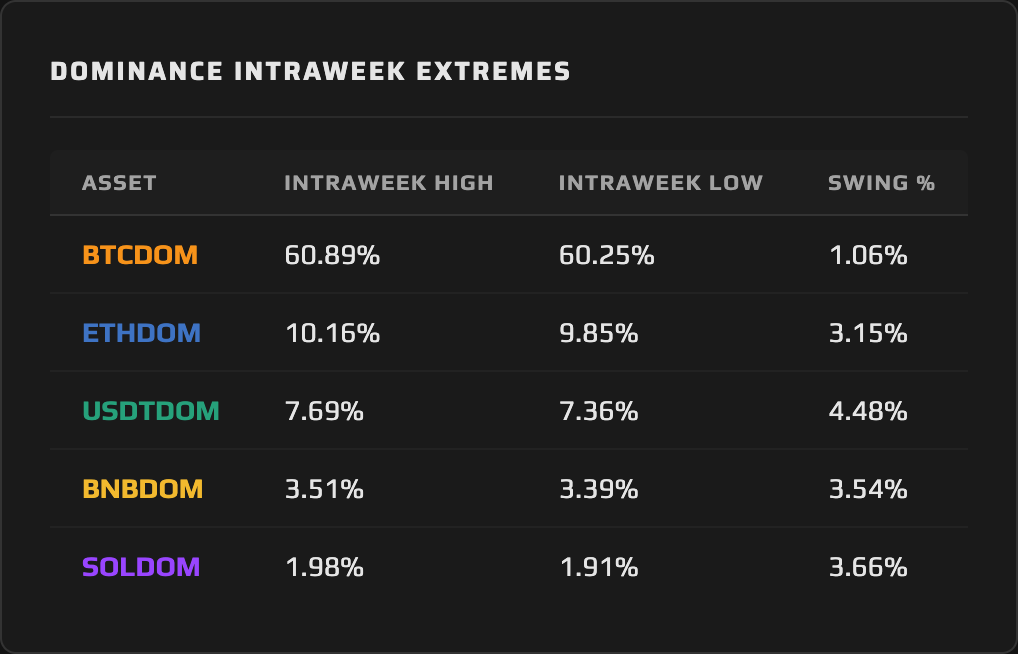
With BNBDOM covered in the deep dive, USDTDOM, BTCDOM, ETHDOM, and Solana Dominance each carry their own story this week, and the matrix rewards reading them together.
The week’s most analytically significant micro-structure belongs to Tether Dominance. USDTDOM opened at 7.45%, exactly where it closed last week after a +6.46% surge and an intraweek tag of the 7.50% regime line. This week the regime-line contest ran again, but harder and faster. On Saturday morning at 07:00 UTC, USDTDOM spiked to 7.69%, pushing above last week’s 7.50% intraweek high and registering the highest dominance reading in the current period. The risk-off thesis had its moment. By Saturday’s close, all of it was gone: USDTDOM settled back at 7.45% and closed the week at 7.46%, a gain of just +0.07% WoW. The Saturday spike tagged the level and failed to hold. Two consecutive weeks with intraweek excursions above 7.50%, two consecutive weekly closes below it. The 7.50% regime line is not being broken on close; it is being tested, rejected, and reinforced. Until a weekly close carries USDTDOM above 7.50%, the risk-off thesis remains contained to intraweek bursts.
The USDTDOM swing of 4.48% (the largest in the matrix this week) reflects how violent that Saturday move and reversal were, even as the WoW close-to-close is essentially flat. The stablecoin aggregate supply being unchanged confirms what last week’s data showed: USDTDOM’s volatility is coming from ratio mechanics as risk assets move, not from fresh minting or redemption events. USDTDOM at 7.46% on flat supply means the risk complex around it is oscillating, not trending.
Bitcoin Dominance closed at 60.71%, down 0.27% from 60.88%. The story here is what did not happen. IBIT, ARKB, and FBTC collectively saw hundreds of millions in outflows across the week, with Monday’s $448 million IBIT redemption one of the largest single-day institutional selling events of 2026. Bitcoin Dominance barely registered it. The intraweek range was 1.06% (60.25% Saturday to 60.89% Monday), the tightest in the matrix. BTCDOM absorbed nearly $900 million in cumulative weekly ETF outflows across ARKB, IBIT, and FBTC, closing within a rounding error of where it opened, structurally intact.
Ethereum Dominance produced the largest weekly close-to-close move in the matrix at −1.15%, sliding from 10.08% to 9.96%. More important than the WoW print is the intraweek structure: ETHDOM tagged 9.85% at 07:00 UTC Saturday, the same hour USDTDOM was pushing its high, and closed the week at 9.96%, back above 10.00%. The 10.00% level was tested, not taken on a weekly closing basis. An intraweek touch of 9.85% is a probe; a weekly close below 10.00% would be a structural statement. ETHDOM’s 3.15% intraweek swing was the third-largest in the matrix, behind USDTDOM and Solana Dominance. The narrative overlay is worth the attention: eight senior Ethereum Foundation leaders have departed in 2026, five in May alone, and former EF researcher Dankrad Feist publicly proposed a new institution with over $1 billion in resources explicitly tasked with defending Ether’s competitive position. That call landed in the same week when ETHDOM probed below 10.00% on an hourly basis. Whether buyers defend these dominance levels will be the central question heading into the PCE session.
Solana Dominance was the quietest pair in the matrix. SOLDOM moved from 1.93% to 1.94%, a gain of +0.37%, spending the week in a tight range between 1.91% and 1.98%. After last week’s −5.94% loss and the break below 2.00%, the stabilization is notable, but the range is too tight and the time too short to call it a structural base. Thursday’s intraweek tag at 1.98% failed to hold; the Saturday low of 1.91% was bought before close. SOLDOM closed 1.94% in back-to-back weeks, with resolution pending.
Synthesis: This was a compression week, not a resolution week. USDTDOM probed above the regime line and retreated; BTCDOM absorbed institutional selling without breaking; ETHDOM tested below 10.00% and closed back above it; BNBDOM was the only pair to decisively expand. The full dominance picture describes a market in pause: the risk-off thesis is present but could not clear its own overhead test, and the risk-on thesis has no catalyst yet to press higher. The dominance regime remains contested at every key level, with the resolution likely coming from Friday’s PCE print and the Deribit expiry in the same session.
5. THE WEEK AHEAD — EVENTS CALENDAR
Monday, May 25 — US equity and bond markets closed for Memorial Day. Reduced US-driven crypto flow expected through the early session.
Thursday, May 28 — Q1 2026 GDP, Second Estimate (Prior advance estimate: +2.0% annualized) | Initial Jobless Claims (prior week).
Friday, May 29 — PCE Price Index, April (Fed’s preferred inflation gauge) | Deribit Monthly BTC Options Expiry: ~80,535 contracts, ~$6.25B notional; max pain $75,000; largest put concentration $75K strike ($394M notional); call wall $80K strike ($532M notional); put/call ratio 0.86.
Unlocks (weekly) — Solana: ~$115M linear unlock (499,470 SOL over 7 days) | Aptos: ~$61.5M cliff unlock (11.31M APT, ~1.61% of unlock supply).
What to Watch for Dominance: Friday May 29 is the session to watch. A hot PCE restarts the higher-for-longer repricing that USDTDOM has twice tried to express through 7.50%; a clean weekly close above that level would confirm the risk-off structure the past two weeks have been building. A soft PCE shifts attention to the expiry mechanics: if BTC drifts toward $75K max pain while BNBDOM holds, BNBDOM extends above 3.51% and the two-week structural bid stretches to three. ETHDOM’s 10.00% level is the most sensitive binary: Friday’s combined PCE and expiry volatility will determine whether a weekly close below 10.00% finally arrives.
6. CLOSING REMARK
The quietest week on open-to-close terms in this cycle’s run of Debriefs carried more structural information than it appeared. Three of the key levels that will define the next directional move were probed and either held or failed intraweek, only to be resolved back to neutral on close: USDTDOM tested above 7.50% and retreated, ETHDOM tested below 10.00% and recovered, and BTCDOM weathered the year’s most intense institutional outflow sequence without breaking its structure. The one clean directional signal was BNBDOM. It made no attempt to probe and fail; it simply extended higher for the second consecutive week with a daily close sequence that read like steady institutional accumulation.
What the dominance charts reveal this week is a market that knows where the key levels are and is testing them under the surface rather than clearing them. That kind of contested structure resolves, and it tends to resolve quickly once a catalyst forces the issue. Friday May 29 has the architecture to be that catalyst, with PCE and the Deribit monthly expiry landing in the same session. If the risk-off thesis finally carries USDTDOM through 7.50% on a weekly close, the dominance picture shifts into a new regime. If BTCDOM holds and BNBDOM extends, the quality-rotation read that defined the past two weeks moves from hypothesis to confirmed structure.
This content is produced by domination.finance for informational and educational purposes only. Nothing contained herein constitutes financial or investment advice. Always conduct your own research.