Dominance Debrief #5
USDTDOM swung 8.84% intraweek and still closed down 2.24%, as a $650M short squeeze and record ETF inflows overwhelmed the stablecoin bid. BTCDOM was the only winner, gaining 0.72% to close at 59.86%.
THE DOMINANCE DEBRIEF
Week of April 13 – April 19, 2026
Issue #5
USDTDOM swung 8.84% intraweek and still closed down 2.24%, as a $650M short squeeze and record ETF inflows overwhelmed the stablecoin bid. BTCDOM was the only winner, gaining 0.72% to close at 59.86%.
1. THE WEEK IN DOMINANCE
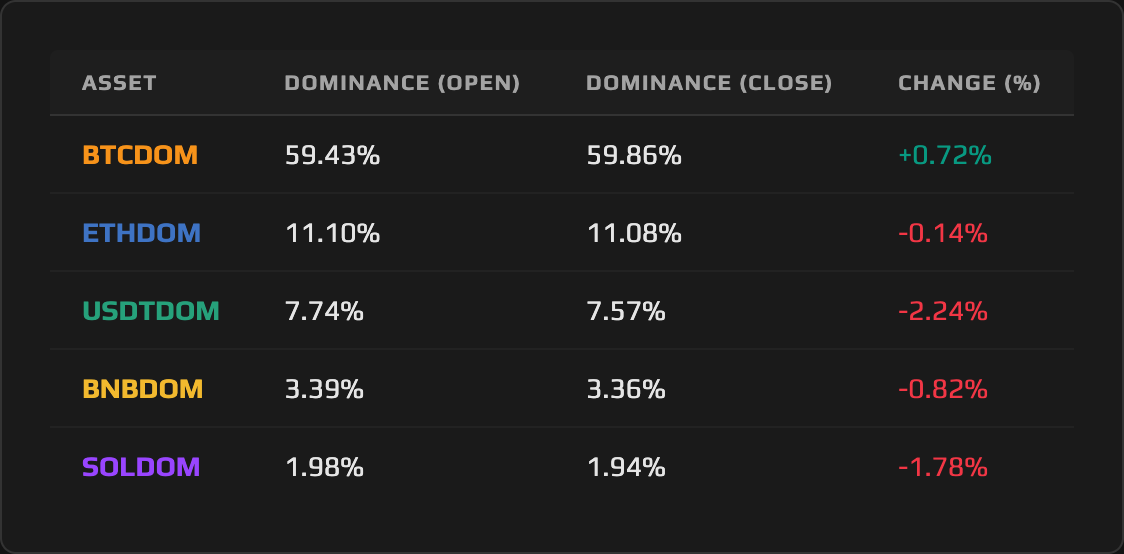
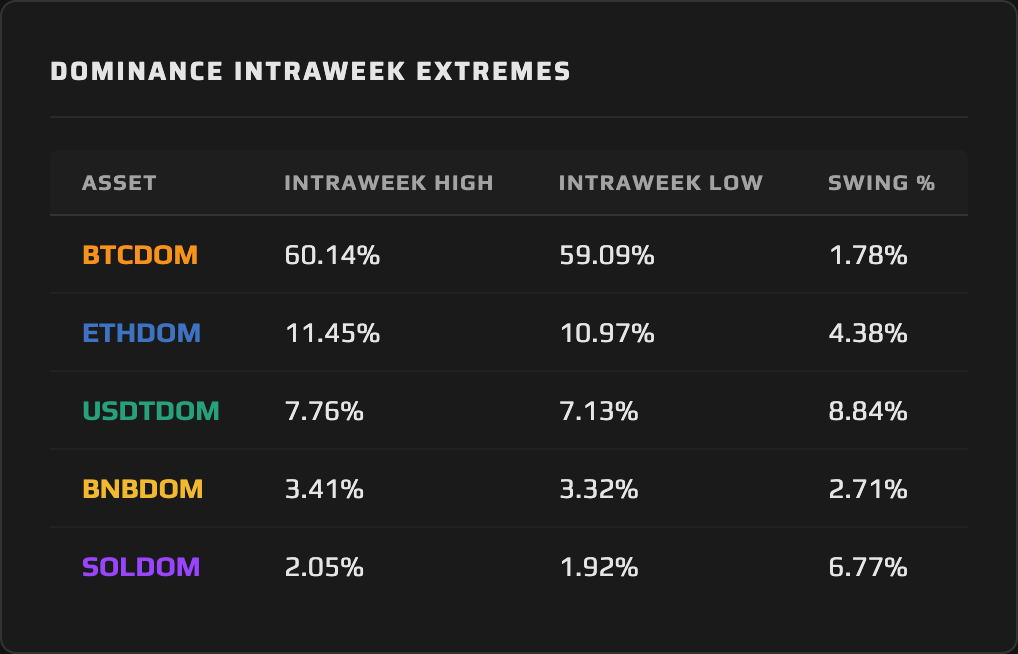
A week defined by violent reversals: USDTDOM carved the widest intraweek swing in the complex at 8.84%, briefly touching 7.76% in early-week risk-off positioning before collapsing to 7.13% as a $650 million short squeeze detonated Tuesday, then closing at 7.57%, down 2.24% on the week. BTCDOM was the sole gainer, rising 0.72% to 59.86%, as BTC absorbed institutional ETF inflows that the broader market could not match. ETHDOM, BNBDOM, and SOLDOM all shed dominance, though through mechanisms distinct enough that grouping them as simple “risk-off losers” misses the real story. The week ended on a new fracture: a $293 million DeFi exploit reignited contagion fears and introduced a second fear regime just as the first was resolving.
2. MACRO CONTEXT — THE BACKDROP
The total crypto market cap opened the week near $2.40 trillion and closed near $2.47 trillion, a gain of roughly 3%. The headline number flatters the week’s structure. What actually happened was two distinct regimes separated by a single detonation: 46 consecutive days of negative BTC funding rates had built the most crowded short position since the post-FTX period, and on Tuesday, April 14, that positioning unwound in a single session. More than 177,000 traders were liquidated, with approximately $515 million from short positions alone. BTC surged 5.7% from $70,700 to above $76,000 within hours, dragging the entire market cap figure upward and compressing the stablecoin dominance that had been building for weeks.
The macro backdrop complicated the picture in both directions. March CPI, released Thursday April 10 just before this window opened, printed +0.9% month-over-month and +3.3% year-over-year, the highest reading since May 2024, with energy the primary driver (gasoline +21.2% on the Iran war). But March PPI, released Tuesday April 15, landed well below expectations: +0.5% month-over-month against a 1.1% consensus, with core PPI just +0.1% versus 0.6% expected. The divergence between headline CPI and a benign PPI read created a genuine ambiguity around Fed sequencing. Markets interpreted the PPI number as a signal that pipeline inflation pressure was softening even as energy drove consumer prices higher, and equities responded accordingly: the S&P 500 gained 4.54% on the week, and the Nasdaq logged an 11-day winning streak with a 6.84% advance. Initial Jobless Claims at 207,000 confirmed the labor market was holding.
The Iran ceasefire negotiated in early April added a second macro layer that cut both ways. Early in the week, peace deal optimism drove risk assets higher and oil lower, with WTI briefly plunging toward $91 on Monday. By Wednesday, Hormuz traffic remained restricted and oil had recovered toward $94.70. By Friday and Saturday, the ceasefire was near expiration, Iran had restricted Strait access again, commercial ships were being attacked, and Trump was threatening to bomb bridges and power plants. Fear & Greed moved from 23 (Extreme Fear) on Monday open to 49 by Sunday close, but the geopolitical situation that drove the recovery late in the week also introduced the conditions for its reversal. The week closed with two unresolved binaries: the Iran timeline and the Powell succession, with Kevin Warsh’s Senate confirmation hearing delayed to April 21.
3. ASSET DEEP DIVE
Tether (USDT) Dominance
Open Price: 7.74% / Close Price: 7.57% / WoW Change: −2.24%
The Structure
Tether Dominance spent the prior two weeks building an expansion structure off the 7.40% floor, consistent with the risk-off positioning that negative BTC funding rates and geopolitical tension were encouraging. The 7.76% intraweek high touched on Monday extended that structure toward the 8.00% level that has served as the cycle’s overhead resistance. Then the structure reversed. The close at 7.57% leaves USDTDOM below its 7.74% weekly open and below the midpoint of its intraweek range, establishing a bearish weekly candle that challenges the expansion narrative. The 7.50% level is now the immediate floor; a weekly close below it next week would confirm that the stablecoin bid has structurally unwound rather than merely consolidated.
This Week’s Price Action
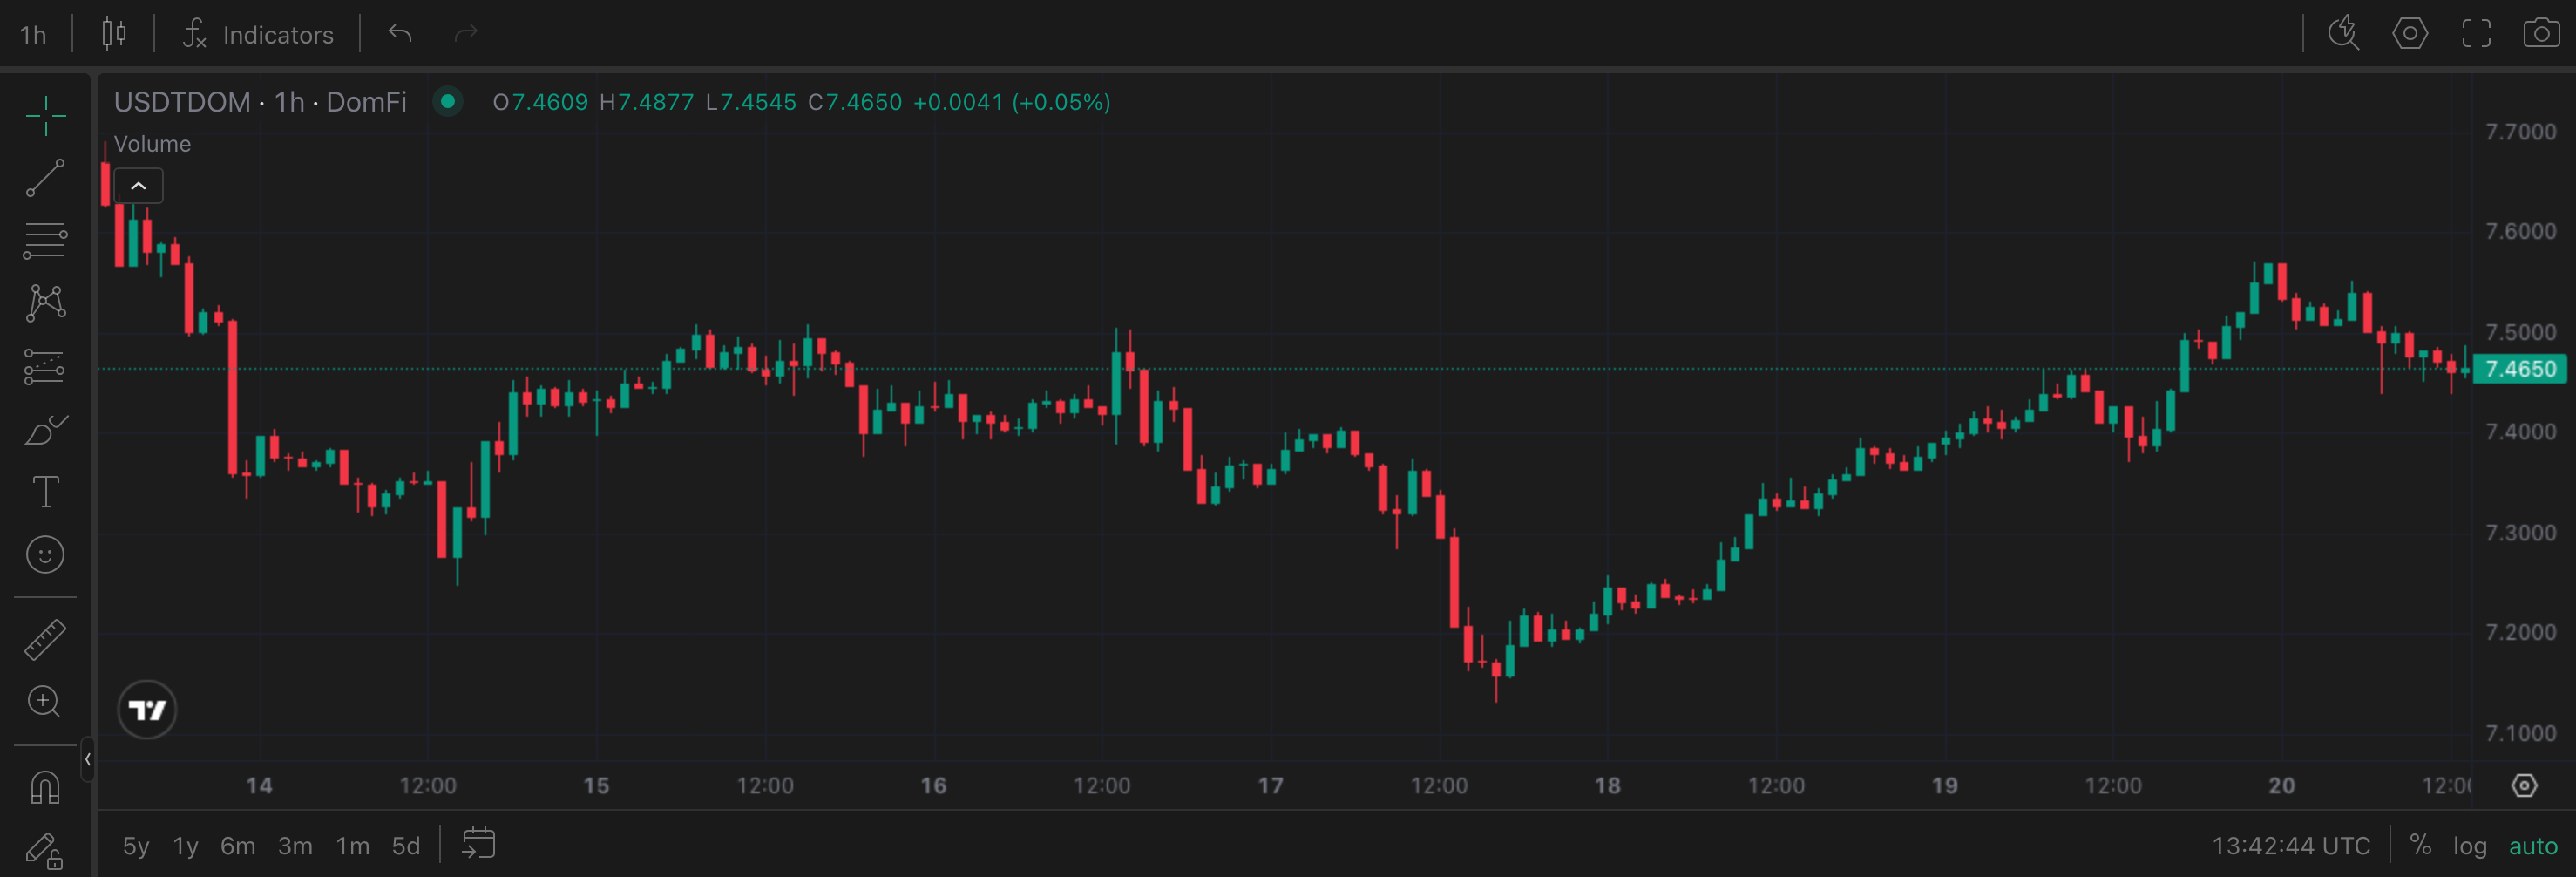
The intraweek structure of USDTDOM is the most analytically significant dominance story of the week, precisely because the 8.84% swing between 7.13% and 7.76% is not noise. It is the footprint of two separate macro regimes colliding in a single seven-day window. USDTDOM opened Monday elevated as geopolitical risk and exhausted short positioning kept the stablecoin bid active. The dominant early-week force was the same fear regime that had been building for over six weeks. Tuesday broke it. The short squeeze detonation sent capital rushing from stablecoins back into risk assets, driving USDTDOM to its 7.13% weekly low in real time. The asset recovered through the week’s back half as geopolitical tension re-escalated around the Iran ceasefire expiration and the Kelp DAO exploit triggered a second contagion fear on Friday and Saturday. The close at 7.57% reflects those competing forces reaching an uneasy equilibrium.
The Daily View
The daily view reveals a sharp V-shaped structure: a three-day compression leg from 7.76% to 7.13% (Monday through Wednesday) followed by a three-day partial recovery leg from 7.13% back toward 7.57% (Thursday through Saturday). The recovery was incomplete. USDTDOM failed to reclaim the weekly open, and the momentum of the recovery slowed noticeably into Friday as Kelp DAO contagion spread through DeFi protocols. Aave lost $8.45 billion in deposits within 48 hours of the exploit, SparkLend and Fluid froze markets, and $13.21 billion in total TVL declined across DeFi. That sequence is analytically relevant to USDTDOM because it affects where stablecoins sit: capital that had parked in DeFi-native yield products was forced out, some of which moved into on-chain USDT and partially cushioned the late-week USDTDOM floor.
The Why
The mechanism behind USDTDOM’s 2.24% weekly decline is a dual compression: the short squeeze expanded BTC and the broader market cap simultaneously, growing the denominator while the USDT supply itself grew only modestly (stablecoin market cap moved from $316.95 billion to $318.88 billion, a $1.93 billion or 0.61% expansion). USDT’s market cap was approximately $186–187 billion during the period. The broader stablecoin complex grew, but at a rate far slower than the risk asset appreciation the squeeze produced. When the denominator expands faster than the numerator, dominance contracts. That is the arithmetic of what happened Tuesday.
The deeper signal is the one inside the stablecoin complex. USDT’s share of total stablecoins has been declining year-to-date as USDC gains share, a rotation that represents a dominance story within the dominance story. The aggregate stablecoin market cap crossing $320 billion mid-week was a headline milestone, but USDTDOM’s weekly decline tells a more precise story: Tether is not capturing all of the stablecoin expansion. USDC’s share gain is the understated signal beneath the aggregate figure. If that rotation continues, USDTDOM can decline even in weeks where total stablecoin supply grows.
The Outlook
The binary for USDTDOM next week is cleaner than the week’s action suggests. If the Iran ceasefire collapses and risk-off conditions return, USDTDOM snaps back toward 7.74%–8.00%. The ingredients are in place: the ceasefire expiration window sits April 21–22, Trump’s escalatory language has already been priced into oil but not into crypto dominance positioning. If de-escalation holds and the short squeeze euphoria continues, USDTDOM breaks below 7.50% and tests the 7.30%–7.40% support band. The Warsh hearing Tuesday introduces a secondary variable: a hawkish signal on monetary policy tightens the rate-of-change expectation and provides a fresh tailwind for safe-haven positioning inside crypto. Watch the 7.50% level as the regime indicator; USDTDOM’s relationship to that floor will tell you which scenario is resolving.
4. THE DOMINANCE MATRIX
ETHDOM (−0.14%), BNBDOM (−0.82%), and SOLDOM (−1.78%) describe a descending ladder of dominance loss with a structural asymmetry: two of those moves reflect market share compression from denominator expansion, while the third signals something more specifically fundamental.
Starting with Solana Dominance at −1.78%, the largest decline in the non-featured pairs. SOLDOM opened at 1.98%, closed at 1.94%, and its 6.77% intraweek swing was the second-widest in the complex after USDTDOM. The swing structure is the analytical key: SOLDOM touched 2.05% early in the week as risk appetite returned and Solana ETFs crossed $1 billion in combined AUM, a milestone that briefly attracted fresh institutional attention. The recovery failed. By week’s close, Solana Dominance had shed ground despite SOL’s price gaining 2.48%. A price gain accompanied by a dominance decline means the broader market capitalization grew faster than SOL’s market cap. SOL benefited from the squeeze but captured a shrinking share of the recovery. The ETF AUM milestone was real, but not a sufficient catalyst to drive dominance re-expansion when the total market was lifting more broadly.
BNB Dominance fell 0.82%, from 3.39% to 3.36%, against a BNB price gain of 4.04%. The mechanics mirror SOLDOM: price up, dominance down, denominator expanding faster than the asset. Binance burned 2.14 million BNB (approximately $1.32 billion) during the period, a deflationary event that would normally support BNBDOM by compressing circulating supply and applying upward price pressure. The burn happened. BNB’s price reflected it. Tether Dominance still fell more, and BNBDOM still fell. The quarterly burn provides a structural floor to BNB Dominance rather than a catalyst for expansion, particularly in weeks where total market cap recovery is broad enough to outpace the burn’s effect on relative market share. The 3.32% intraweek low and the 3.36% close both remain above the 3.30% structural support, which holds.
Ethereum Dominance tells the most contained story of the week. ETHDOM declined just 0.14%, from 11.10% to 11.08%, against ETH’s 3.31% price gain. For a week with a 4.37% intraweek swing (10.97% low to 11.45% high), a net weekly change of 0.14% represents a near-complete round trip. The 11.45% intraweek high was reached during the short-squeeze session as ETH captured a proportionate share of the risk-on flush. ETH ETF flows came in at $187 million for the week, the strongest of 2026, reversing three consecutive weeks of outflows totaling $308 million. That cumulative ETF reversal is the most analytically significant flow signal in ETHDOM this week: institutional capital that had been exiting the ETH ETF wrapper for three weeks re-entered in a single session. The fact that ETHDOM closed virtually flat despite that inflow reversal reflects how aggressively the total market denominator expanded. Ethereum captured its institutional bid and still barely held its share. The 10.97% intraweek low held above the structural 10.90% floor.
Bitcoin Dominance gained 0.72%, the sole weekly advance among the tracked pairs, rising from 59.43% to 59.86% and touching 60.14% intraweek. The advance is analytically distinct from the other pairs in a specific way: BTC’s price gained 4.38%, and yet BTCDOM still expanded. For every other risk asset, price gains were accompanied by dominance contraction because the denominator grew faster. BTC is the exception this week because institutional flows concentrated there. ETF inflows of approximately $1.7 billion for the week, including $663.9 million on April 17 alone, were overwhelmingly directed at BTC products. Goldman Sachs filing its first BTC ETF product on April 14 was a headline-level signal that sophisticated institutional buyers are still deepening their BTC-specific exposure rather than rotating into the broader complex. The 60.14% intraweek high is the cycle-to-date test of the 60% level; whether BTCDOM closes above 60% on a weekly basis next week is the key structural read.
Synthesis: This week’s full dominance picture describes a market in early-stage deleveraging recovery, but the recovery is asymmetric. BTCDOM gained while every other risk asset shed dominance, which means the capital returning to risk is choosing BTC specifically rather than rotating broadly. USDTDOM’s 2.24% weekly decline is consistent with a genuine stablecoin-to-risk rotation, but the rotation is channeled into BTC ETFs, not dispersed across the complex. Until ETHDOM, SOLDOM, or BNBDOM can sustain a dominance gain alongside rising BTC prices, this remains a Bitcoin-consolidation regime, not a broad risk-on rotation.
5. THE WEEK AHEAD — EVENTS CALENDAR
Monday, April 20 — Hong Kong Web3 Festival opens (Apr 20–23; keynotes from Vitalik Buterin, Binance, OKX, Solana Foundation)
Tuesday, April 21 — Kevin Warsh Senate Banking Committee confirmation hearing for Fed Chair (10 AM ET) | Iran ceasefire expiration window (Apr 21–22)
Wednesday, April 22 — S&P Global Flash US Manufacturing PMI April (Prior: 50.2) | S&P Global Flash US Services PMI April (Prior: 50.6) | S&P Global Flash US Composite PMI April (Prior: 50.6) | WLFI 62.3B token governance vote deadline
Thursday, April 23 — Initial Jobless Claims (Prior: 207K, Consensus: ~215K)
Friday, April 24 — University of Michigan Consumer Sentiment Final April (Preliminary: 47.6; 1-year inflation expectations: 4.8%) | ~$7.9B BTC options expiry on Deribit (max pain: ~$72,000; spot ~$75,000)
What to Watch for Dominance: The Iran ceasefire expiration Tuesday–Wednesday is the highest-magnitude binary for USDTDOM: a collapse drives the stablecoin bid back toward 7.74%–8.00%, while a negotiated extension opens the path to 7.30%–7.40%. The Deribit $7.9B options expiry Friday, with max pain at $72,000 against current spot near $75,000, creates mechanical gravitational pull toward max pain that would compress BTC’s price and, in turn, weigh on BTCDOM’s ability to sustain a close above 60%. The University of Michigan Consumer Sentiment final read, with its preliminary at a 74-year survey low and 1-year inflation expectations at 4.8%, is the macro variable most likely to reset risk appetite downward if it confirms or worsens; a deteriorating sentiment print tends to widen the BTCDOM–USDTDOM spread as investors position defensively within crypto.
6. CLOSING REMARK
The dominant theme of this week is not the short squeeze, the record ETF inflows, or the geopolitical whipsaw. It is the structure of what recovered and what did not. BTCDOM is the only risk asset that closed the week with more market share than it started with, and it did so while every institutional flow signal this week — BTC ETF inflows at their strongest since January, Goldman Sachs entering the product space, Strategy adding to its position — pointed in a single direction. The market is not rotating into crypto broadly. It is concentrating into Bitcoin specifically.
That concentration is the defining dominance signal of the current regime, and it narrows the analytical focus to one question: when does the rotation broaden? ETHDOM’s institutional flow reversal this week (from three weeks of outflows to $187 million of inflows in a single week) is the earliest signal that the answer may not be far off. But “earliest signal” and “confirmed” are different readings, and the geopolitical overhang ensures that USDTDOM remains coiled at levels where a single headline can reactivate the defensive bid in hours. The dominance charts are telling a story of selective recovery inside a fragile macro environment. The fragility is not gone.
This content is produced by domination.finance for informational and educational purposes only. Nothing contained herein constitutes financial or investment advice. Always conduct your own research.