Dominance Debrief #4
US-Iran ceasefire flipped the Fear & Greed Index from 8 to 51 in six days. ETHDOM broke the 11.09% resistance it tested all spring. BTCDOM gained while BNBDOM and SOLDOM bled — selective risk-on, not broad.
THE DOMINANCE DEBRIEF
Week of April 6 – April 12, 2026
Issue #4
US-Iran ceasefire flipped the Fear & Greed Index from 8 to 51 in six days. ETHDOM broke the 11.09% resistance it tested all spring. BTCDOM gained while BNBDOM and SOLDOM bled — selective risk-on, not broad.
1. THE WEEK IN DOMINANCE
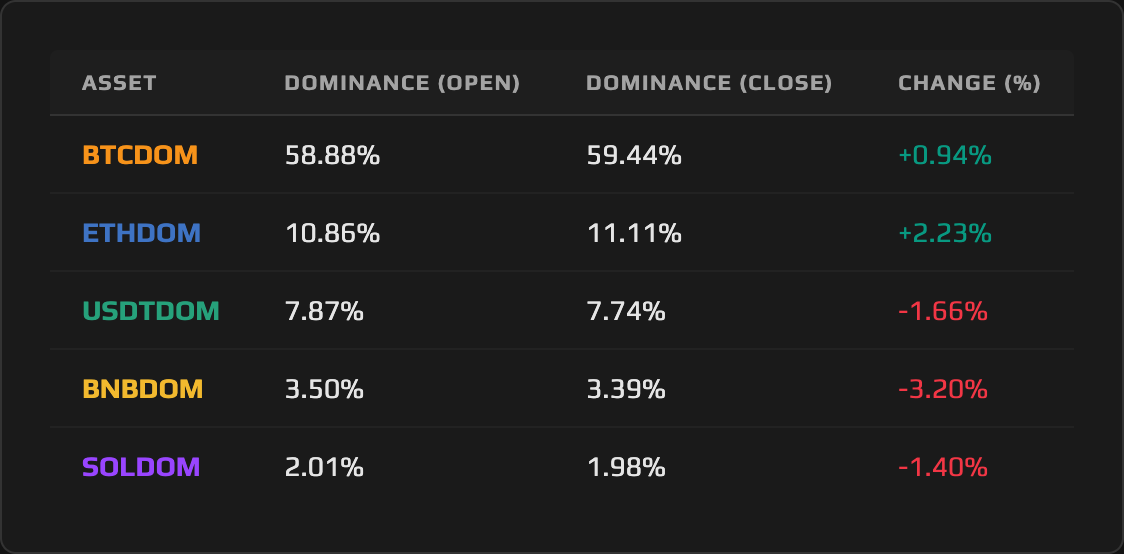
The defining story of this week is selectivity. A geopolitical shock that briefly cratered oil, a hot CPI print that the market chose to read as transitory, and the strongest equity week since November all converged to lift sentiment from Extreme Fear to Greed in a single trading week. But the dominance picture was not uniformly green. Ethereum Dominance was the standout, rising +2.23% to close at 11.11% and breaking cleanly above the 11.09% resistance that had capped the prior week’s rally. BTCDOM added +0.94%, extending its slow grind higher. USDTDOM fell -1.66% as capital rotated out of stablecoins. BNBDOM dropped -3.20%, extending its decline on compounding regulatory pressure. SOLDOM shed -1.40%, still digesting the Drift Protocol fallout. The market opened the stablecoin safe-haven trade and deployed selectively into BTC and ETH, leaving BNB and SOL behind.
2. MACRO CONTEXT — THE BACKDROP
The total crypto market cap expanded from approximately $2.33 trillion to $2.36 trillion over the week, a +1.6% gain that understates the drama of the journey. The week opened with a binary event: on April 7–8, Pakistan brokered a two-week ceasefire between the US and Iran, with Iran agreeing to reopen the Strait of Hormuz. WTI crude crashed -16.41% to $94.41 a barrel on the news. The immediate read for crypto markets was straightforwardly bullish: oil down means energy-driven inflation pressure eases, the geopolitical risk premium collapses, and risk assets re-rate. BTC surged from approximately $68,270 to $72,700 in the two-day window following the announcement, triggering approximately $600 million in liquidations, with more than $400 million of that concentrated in short positions. The ceasefire began unraveling within hours as both sides accused each other of violations, oil bounced back above $100, and the Hormuz uncertainty re-established itself. The brief euphoria was real; the resolution was not.
The week’s two scheduled macro events added texture without flipping the narrative. FOMC Minutes from the March meeting, released Wednesday April 8, carried a hawkish tilt: some officials cited a “strong case” for rate increases if inflation remained sticky, with the median 2026 forecast still projecting only one cut before year-end and the funds rate at 3.50–3.75%. Markets absorbed this relatively calmly; the minutes post-dated a decision already priced. Thursday’s CPI release was the more consequential print. Headline inflation came in at +0.9% month-over-month and 3.3% year-over-year, above the 2.4% prior, driven by a 21.2% monthly surge in gasoline prices. Core CPI at +0.2% MoM and 2.6% YoY came in 0.1% below forecast on both measures. The market’s interpretation was decisive: energy-driven, transitory. BTC rallied to $72,400 on the release. Steel, aluminum, and copper tariffs at 50% took effect on April 6, adding a second-order inflationary input the market chose to set aside for now. Initial jobless claims at 219K, above the 212K consensus, gave the soft-landing narrative a minor knock without disrupting the prevailing mood.
The aggregate result was the S&P 500’s best week since November, up +3.6%, and the Nasdaq up +4.7%. Fear & Greed, which had been pinned in Extreme Fear for more than sixty consecutive days, touched 51 (Greed) by April 11. Crypto’s dominance data tells the story of how that sentiment recovery expressed itself: not uniformly, but channeled along fault lines already established by regulatory risk and protocol-specific stress.
3. ASSET DEEP DIVE
Ethereum (ETH) Dominance
Open: 10.86% / Close: 11.11% / WoW Change: +2.23%
The Structure
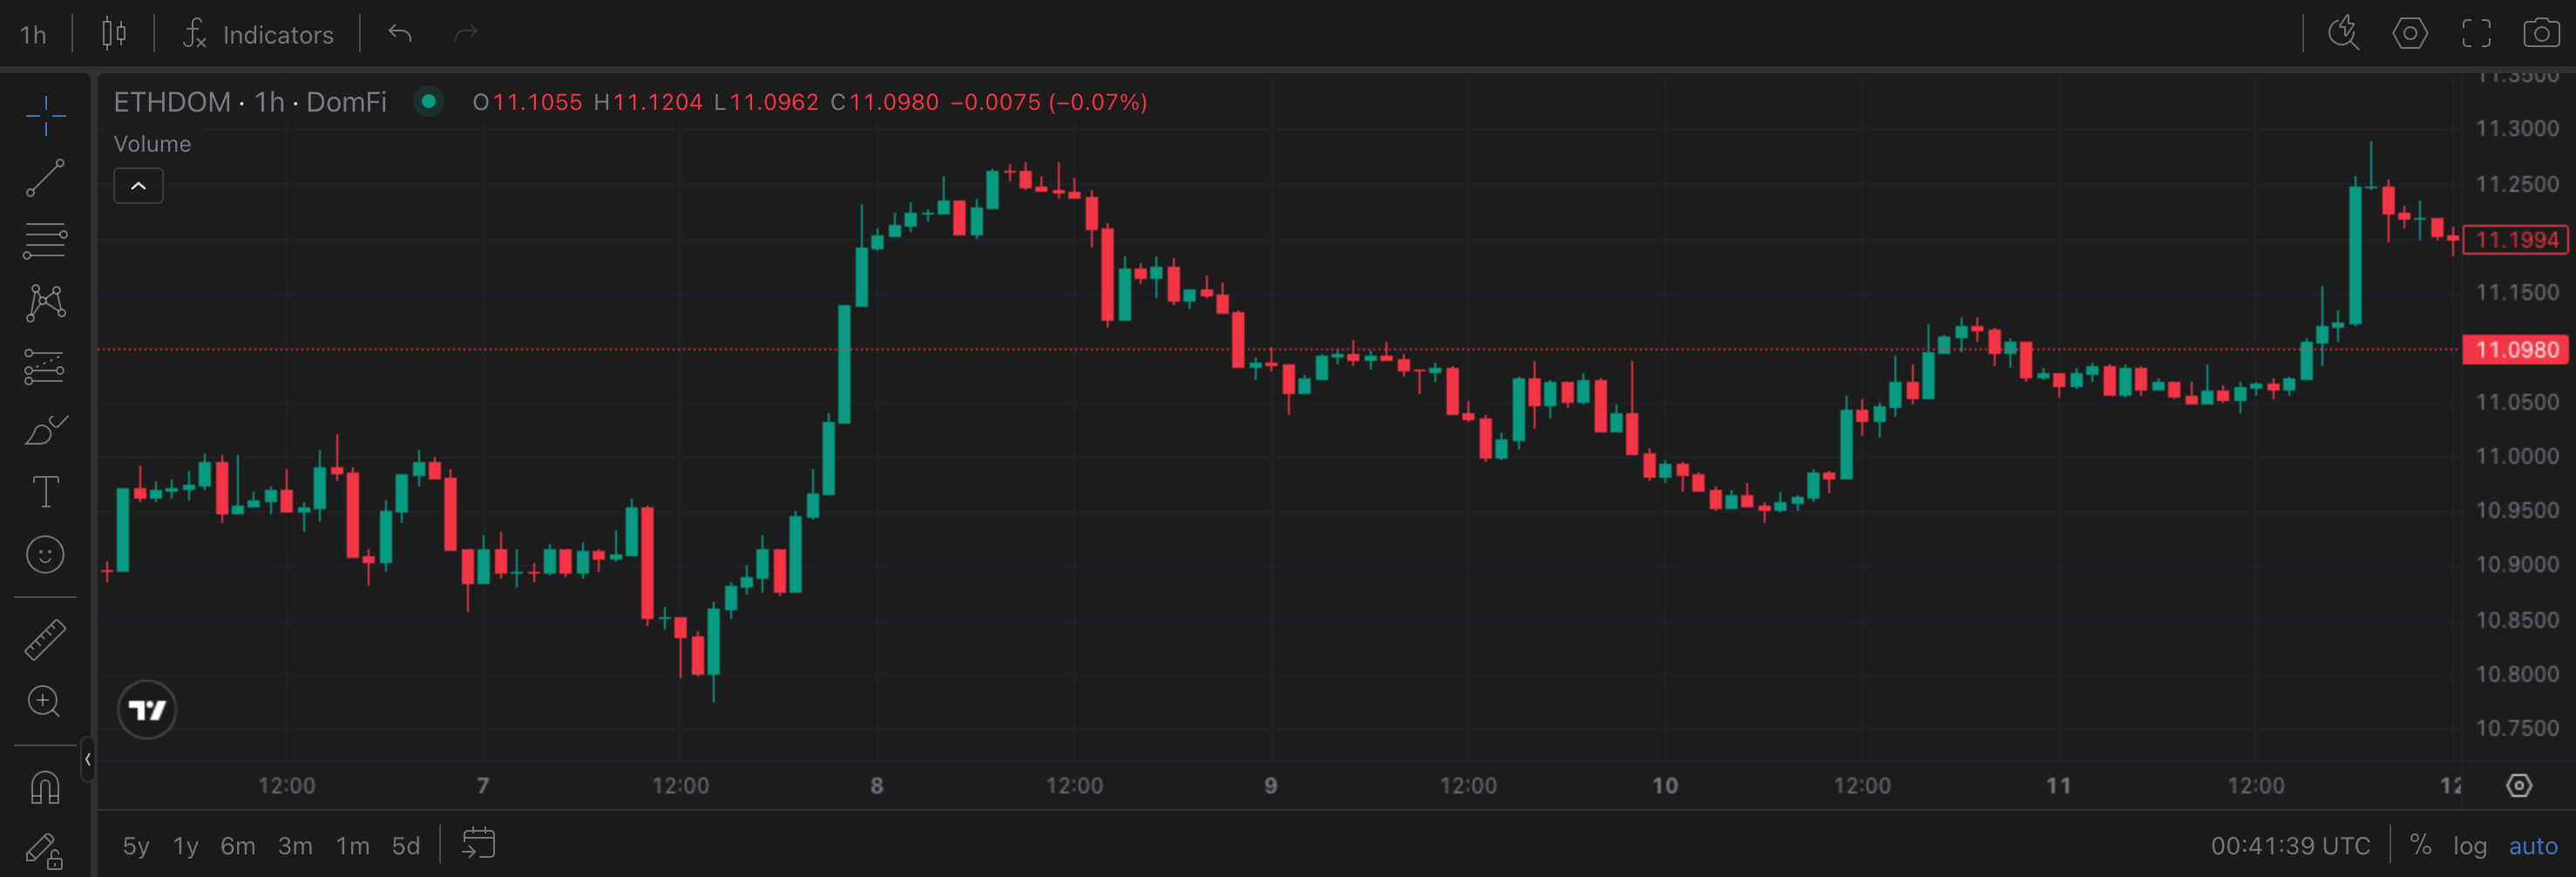
Ethereum Dominance has been testing the 11.09% level for two consecutive weeks, probing above it intraweek before pulling back to close below. This week broke that pattern. ETHDOM opened Monday at 10.86%, spent most of the early week below the 11.09% ceiling, then pushed through decisively to record an intraweek high of 11.29% and a weekly close of 11.11%. That close above 11.09% is the structural confirmation the prior week’s rally failed to deliver. The level has now flipped from resistance to a prospective support test. Above it, the next structural target is the 11.40–11.50% band; below it, the range reverts to contested territory.
This Week’s Price Action
The weekly candle covers a +2.23% dominance gain against a backdrop of ETH price rising from $2,109 to $2,192, a +3.94% move. ETH outperformed BTC’s +2.57% price gain on the week, and that relative outperformance is one of two mechanisms driving the dominance expansion. When ETH’s market cap grows faster than the total market cap, ETHDOM expands from the asset side. The second mechanism was denominator compression at the start of the week: BNB and SOL lost market cap in dollar terms while ETH gained, meaning Ethereum was growing its share against a denominator pulled in conflicting directions. The combination produced a clean, unambiguous dominance expansion that outpaced every other risk asset tracked this week.
The Daily View
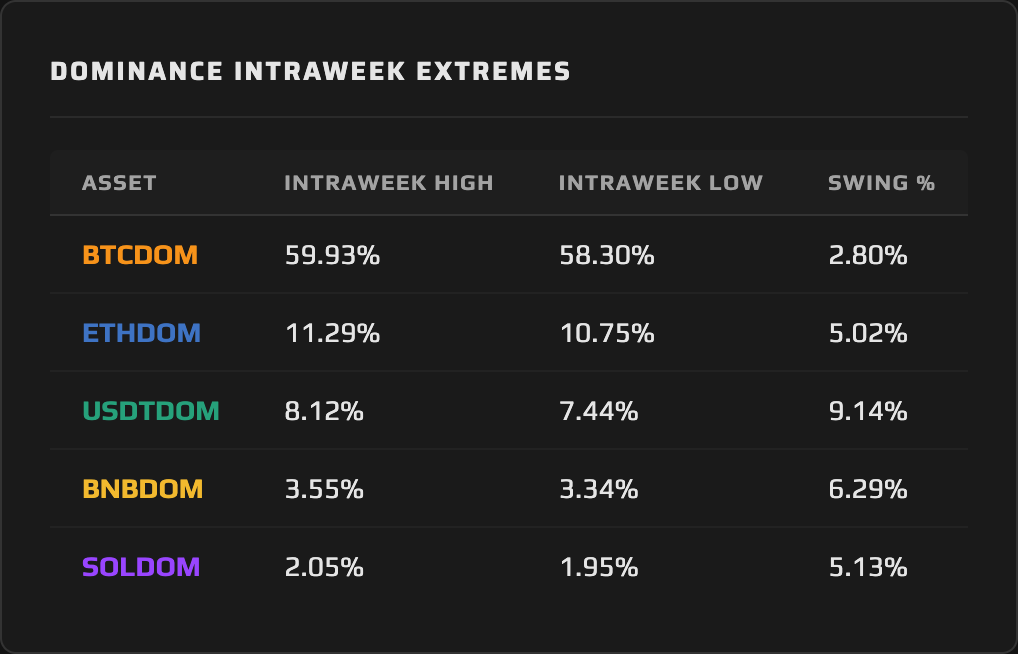
The intraweek dominance structure was not a straight line. ETHDOM dipped from Monday’s 10.86% open to a weekly low of 10.75% early in the week as initial positioning remained cautious. The turn came mid-week, coinciding with the FOMC Minutes release and ETF inflow confirmation: Ethereum ETFs logged $120 million in net inflows on April 6 alone, ending a prior outflow streak, with BlackRock’s ETHA absorbing $53.7 million. By April 10, a further 23,039 ETH had been absorbed across ETF products. Cumulative net ETF inflows returned to $11.60 billion. That flow confirmation catalyzed the push through 11.09%, with ETHDOM printing its 11.29% intraweek high on the session following CPI. The 5.02% intraweek swing, from 10.75% to 11.29%, was the largest swing of any risk asset tracked this week and reflects a market that moved from hesitation to conviction across a single trading window.
The Why
Three distinct forces contributed to ETHDOM’s +2.23% move, and collapsing them into a single driver would miss the analytical substance. The first was ETF demand: institutional flows into spot Ethereum ETFs provided a direct bid on ETH’s market cap relative to the total market. The second was regulatory optionality: SEC Chair Paul Atkins sent the agency’s “Reg Crypto” proposal to the White House on April 7, signaling new rulemaking on Securities Act fundraising and startup exemptions. While the proposal doesn’t resolve ETH’s classification directly, it reduces the regulatory ceiling that had been suppressing ETH-specific institutional deployment. The third was supply-side absorption: ETH exchange reserves hit a yearly low at 14.9 million ETH during the week, with 3.4 million ETH sitting in the staking validator queue. When exchange supply contracts and ETF demand expands simultaneously, the price appreciation is amplified — and price appreciation, when it runs faster than total market expansion, translates directly to dominance gains. The Ethereum Foundation’s 5,000 ETH TWAP sale via CoWSwap did create minor selling pressure, but at roughly $11 million in notional terms against $64.9 million in daily ETF absorption, the net flow picture remained firmly positive.
The Outlook
ETHDOM at 11.11% with a confirmed weekly close above 11.09% puts the bull case in the lead. If ETF inflows continue at last week’s pace and the broader risk-on sentiment holds through any fresh Hormuz headlines, the path to 11.40–11.50% is open. A sustained close above 11.29%, the week’s intraweek high, would extend the higher-high structure and formally confirm the breakout. The bear case requires one of two triggers: a broad risk-off reset that hits ETH price harder than the total market — possible if Hormuz tensions re-escalate sharply — or a meaningful reversal in ETF flows. The 11.09% level is now the support to watch. A weekly close back below it reopens the range. Until then, Ethereum Dominance has cleared the ceiling it spent two weeks testing, and the structural picture is constructive.
4. THE DOMINANCE MATRIX
The Compression Pair: BNBDOM and SOLDOM
BNB Dominance fell -3.20% on the week, moving from 3.50% to 3.39%, and Solana Dominance shed -1.40%, from 2.01% to 1.98%. The magnitudes differ, but both pairs declined against a backdrop where the broader market was posting risk-on gains. That divergence from the week’s prevailing direction is the analytical entry point.
BNBDOM’s -3.20% move is the sharpest weekly decline in the matrix this week, and it did not arrive in a vacuum. Grayscale dropped BNB from its Q2 watchlist, trimming the token from a 36-asset watch list to 30, alongside Aptos, Arbitrum, and Polkadot. Institutional watchlist exclusions are leading indicators of flow behavior: the funds tracking Grayscale’s signals reduce their prospective BNB exposure, the anticipated bid softens, and dominance compresses. This compounds on top of the Blumenthal Senate investigation of Binance’s records, which the prior week identified as a structural headwind. The BNBDOM close at 3.39% is now testing the 3.40% structural floor identified in last week’s analysis. A weekly close below that level formally confirms the breakdown. The intraweek swing of 6.29%, from a low of 3.34% to a high of 3.55%, shows the range is still contested — but each failed recovery from the low leaves the structural floor more brittle.
Solana Dominance tells a slightly different story. SOLDOM’s -1.40% decline, from 2.01% to 1.98%, reflects persistent Drift Protocol fallout rather than fresh selling pressure. The $285 million exploit from April 1 continued to suppress Solana DeFi activity: total value locked on Solana dropped from $8.1 billion to $7.1 billion across the week, a -12% decline in ecosystem capital. When DeFi TVL contracts at this pace, the SOL market cap faces both direct selling pressure from users exiting the ecosystem and a narrative headwind that slows fresh inflows. SOL’s price move of -0.36% confirms a market that has largely re-priced the risk but hasn’t re-engaged with the opportunity yet. The intraweek swing of 5.13%, from 1.95% to 2.05%, shows the market testing both sides without conviction in either direction.
The contrast between these two pairs and ETHDOM’s +2.23% gain is sharp and instructive. Both BNBDOM and SOLDOM faced asset-specific headwinds — regulatory and exploit-driven, respectively — that prevented them from participating in the week’s broad risk-on recovery. The ceasefire euphoria, the CPI read-through, and the equity rally lifted ETH and BTC. It did not lift assets carrying structural overhangs. This is selective risk-on, not broad risk appetite.
Bitcoin Dominance: The Quiet Gainer
BTCDOM added +0.94%, moving from 58.88% to 59.44%, and the nature of that gain deserves scrutiny. Bitcoin Dominance rising in a week where ETH also gained dominance is unusual: the two pairs have historically moved in opposition, with BTC dominance expanding during risk-off periods (as capital concentrates in the largest asset) and contracting during risk-on rotations (as capital spreads into alts). This week’s simultaneous gain in both BTCDOM and ETHDOM tells a more specific story: capital leaving BNBDOM, SOLDOM, and USDTDOM rotated into the two most liquid, most institutionally established assets, rather than spreading across the full altcoin complex. The risk-on read was real but limited by the ecosystem’s fault lines.
Bitcoin’s own flow data supports this. BTC exchange reserves fell to a 9-year low at 2.21 million BTC during the week, with approximately 7,900 BTC flowing off exchanges on April 9–10. Bitcoin ETFs logged $471 million in net inflows on April 6 alone, with BlackRock’s IBIT taking in $181.9 million and Fidelity’s FBTC $147.3 million. The combination of exchange outflows and ETF absorption is the cleanest possible signal for BTC’s market cap, and it drove dominance expansion even as ETH was simultaneously claiming more ground. The intraweek BTCDOM swing of 2.80%, from 58.30% to 59.93%, captures the full arc of the ceasefire rally and CPI re-rating in a single range.
Tether Dominance: The Safe-Haven Exhale
Tether Dominance fell -1.66% on the week, from 7.87% to 7.74%. After four weeks of expansion driven by geopolitical and macro risk-off dynamics, USDTDOM finally gave back ground as capital deployed into risk assets. The aggregate stablecoin market cap expanded from $316.19 billion to $317.57 billion, a +0.44% rise, which means the USDTDOM decline was driven by crypto risk assets growing their market cap faster than stablecoins, not by net stablecoin outflows. This is a mechanically important distinction: USDT supply itself did not contract, but the total market’s growth outpaced it.
The intraweek USDTDOM swing of 9.14%, from 7.44% to 8.12%, is the largest intraweek swing of any pair tracked this week — a reflection of just how violently sentiment oscillated between ceasefire euphoria and re-escalation fear within a single week. The opening Hormuz-closure shock briefly pushed USDTDOM to 8.12% before the ceasefire announcement collapsed it, and the subsequent Hormuz uncertainty brought it partially back. The weekly close at 7.74% represents a consolidation at the lower end of the intraweek range, consistent with a market that settled on cautious optimism rather than either extreme.
The USDC/USDT dynamic running beneath the surface deserves mention as a dominance story within the dominance story. USDC captured 64% of stablecoin transaction volume year-to-date in 2026, the first time it has surpassed USDT in transaction share since 2019. USDT retains its lead in market cap, but transaction volume share is how stablecoin utility gets priced in institutional and DeFi contexts. If this trend continues, the question of intra-stablecoin dominance becomes a first-order question for how the dominance picture evolves, and a pair tracking USDT’s share of the stablecoin basket would surface exactly this dynamic in tradeable form.
Synthesis: The full dominance picture this week describes a selective risk recovery, not a broad reflation. Capital rotated out of USDTDOM into BTCDOM and ETHDOM, bypassing BNBDOM and SOLDOM entirely. The two assets with clean institutional flows and no active regulatory overhang gained. The two with structural headwinds bled further. This is not a market that has resolved its risk appetite; it is a market that has identified which assets it trusts enough to buy on a ceasefire headline and which ones it won’t touch until the overhangs clear.
5. THE WEEK AHEAD — EVENTS CALENDAR
Monday, April 13 — Section 232 auto parts tariff window closes | Binance Senate records deadline (Blumenthal investigation)
Tuesday, April 14 — PPI (March): Prior: +0.7% MoM, +3.4% YoY | Starknet (STRK) unlock: 127M STRK (~1.27% of total supply)
Tuesday–Wednesday, April 15–16 — Paris Blockchain Week, Paris: Macron speaking on stablecoins/digital euro; Allaire, Hoskinson, JPMorgan, Deutsche Bank in attendance
Wednesday, April 16 — Industrial Production & Capacity Utilization (Prior: 76.3% utilization)
Thursday, April 17 — Initial Jobless Claims (Prior: 219K) | Philly Fed Manufacturing Index (Prior: 18.1) | Deribit weekly BTC/ETH options expiry
What to Watch for Dominance: PPI on Tuesday is the week’s highest-impact data point for dominance: a hot print above consensus would reopen the “sticky inflation” narrative the CPI week tried to close, likely pushing USDTDOM back toward 8.00% while compressing BTCDOM and ETHDOM. Paris Blockchain Week carries a specific ETHDOM signal: Macron’s remarks on the digital euro and any stablecoin regulatory framing could affect ETH’s RWA thesis, and if institutional speakers signal renewed deployment into Ethereum-based infrastructure, ETHDOM could press toward 11.40%. The Binance records deadline on Monday is the proximate test for BNBDOM: if new disclosures from the investigation surface, the 3.39% close becomes the entry into a fresh breakdown leg.
6. CLOSING REMARK
This week’s dominance picture should be read as a stress test of the market’s conviction, not a confirmation of broad recovery. The total crypto market cap added roughly $30 billion, Fear & Greed flipped from Extreme Fear to Greed, and equities posted their best week in months. Yet two of the tracked dominance pairs declined through all of it. The dominance charts don’t lie about this: BNBDOM and SOLDOM didn’t participate in the recovery because the market decided their specific risk profiles were not worth buying on a geopolitical headline. The ceasefire bounced the assets with clean institutional sponsorship. Everything else waited.
The week’s signal to carry forward is ETHDOM’s structural breakout. Two consecutive weeks of testing 11.09% and now a weekly close above it marks a shift in the medium-term structure. The prior issue identified this level as the key resistance; this week’s close above it, backed by $184.9 million in ETF inflows across the week and exchange reserves at yearly lows, changes the framing. If ETHDOM holds 11.09% as support through the PPI print and any fresh Hormuz noise, the rotation trade into ETH has moved from speculative to structured. The dominant question for the next week is whether that support holds when macro pressure returns — and with the FOMC blackout starting Saturday, the next policy catalyst doesn’t arrive until April 29.
This content is produced by domination.finance for informational and educational purposes only. Nothing contained herein constitutes financial or investment advice. Always conduct your own research.