Dominance Debrief #6
USDTDOM broke below the 7.50% regime floor, closing at 7.32%, as BTC absorbed $2.43B in ETF inflows and Strategy's largest buy since 2024. BTCDOM closed above 60% for the first time this cycle. Risk is back — and it is concentrated.
THE DOMINANCE DEBRIEF
Week of April 20 – April 26, 2026
Issue #6
USDTDOM broke below the 7.50% regime floor, closing at 7.32%, as BTC absorbed $2.43B in ETF inflows and Strategy’s largest buy since 2024. BTCDOM closed above 60% for the first time this cycle. Risk is back — and it is concentrated.
1. THE WEEK IN DOMINANCE
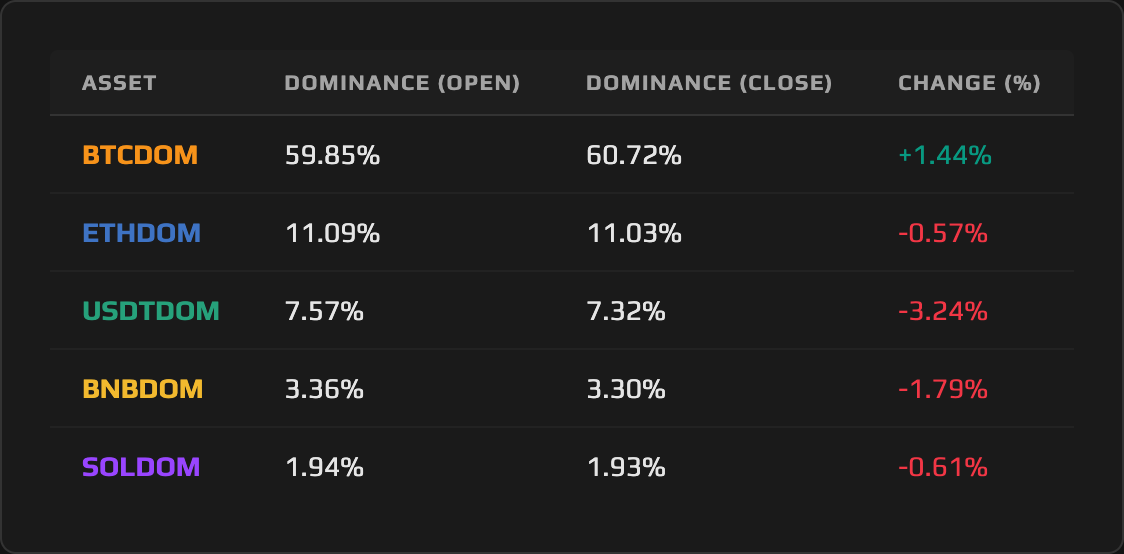
Last week’s outlook named 7.50% as the USDTDOM regime indicator. This week, Tether Dominance broke it decisively, closing at 7.32%, down 3.24%, as de-escalation in Iran combined with the sharpest institutional capital concentration this cycle has produced. BTCDOM was the lone gainer, advancing 1.44% to close at 60.72% — its first weekly close above 60% this cycle. ETHDOM, BNBDOM, and SOLDOM all shed dominance, but through a mechanism that has a specific and non-alarming reading: the total crypto market cap expanded 4.96% while stablecoin supply held essentially flat, creating denominator expansion that mechanically compressed every non-BTC ratio. The regime is risk-on. The capital is not rotating broadly.
2. MACRO CONTEXT — THE BACKDROP
The total crypto market cap opened the week at $2.450 trillion and closed at $2.571 trillion, a gain of 4.96% in seven days. BTC led with a 6.48% price advance from $73,856 to $78,645, outpacing the broad market and extending the institutional concentration thesis that has defined dominance dynamics since February. The Fear & Greed Index opened near 29 (Fear) and closed near 32 (Fear), but the weekly average of 34 understates the volatility inside that range: the index jumped from 32 to 46 in a single session, the largest daily move in three months, before settling back toward the close. Markets were fearful but not paralyzed.
The macro catalyst that unlocked the week was the Trump administration’s extension of the Iran ceasefire. Last week’s outlook identified ceasefire extension as the key trigger for USDTDOM to break below 7.50%, and the resolution arrived. The geopolitical de-escalation cleared the most significant near-term risk-off overhang and opened the door for institutional capital that had been waiting on the sidelines to deploy. On April 22, Kevin O’Leary publicly pivoted to BTC and ETH as his sole crypto holdings, adding a visibility catalyst to an already-moving tape. A Nomura survey released during the week showed 65% of Japanese institutional investors now hold BTC, a data point that frames the institutional absorption not as a US-only phenomenon but as a structural global rotation.
The crowded short regime that had been building for 46 consecutive days of negative BTC funding rates was the structural combustion waiting for a spark. The Iran ceasefire extension provided it. BTC’s 30-day realized volatility jumped from 45% to 68% in April, registering the short squeeze’s force in historical terms. Strategy’s purchase of 34,164 BTC at $2.54 billion, the firm’s largest acquisition since 2024, added a second demand layer on top of ETF inflows. Taken together: eight straight days of BTC ETF inflows totaling $2.43 billion in April, with BlackRock’s IBIT capturing 91% of those flows, combined with a supply shock from Strategy’s purchase, produced the BTC-dominant dominance structure this week’s data confirms. ETF year-to-date flows flipped positive to $1.85 billion after deep Q1 outflows, reversing the cumulative position that had sat negative since BTC’s crash from its November 2025 highs. That YTD flip is a regime signal, not a weekly artifact.
3. ASSET DEEP DIVE
Tether (USDT) Dominance
Open: 7.57% / Close: 7.32% / WoW Change: −3.24%
The Structure
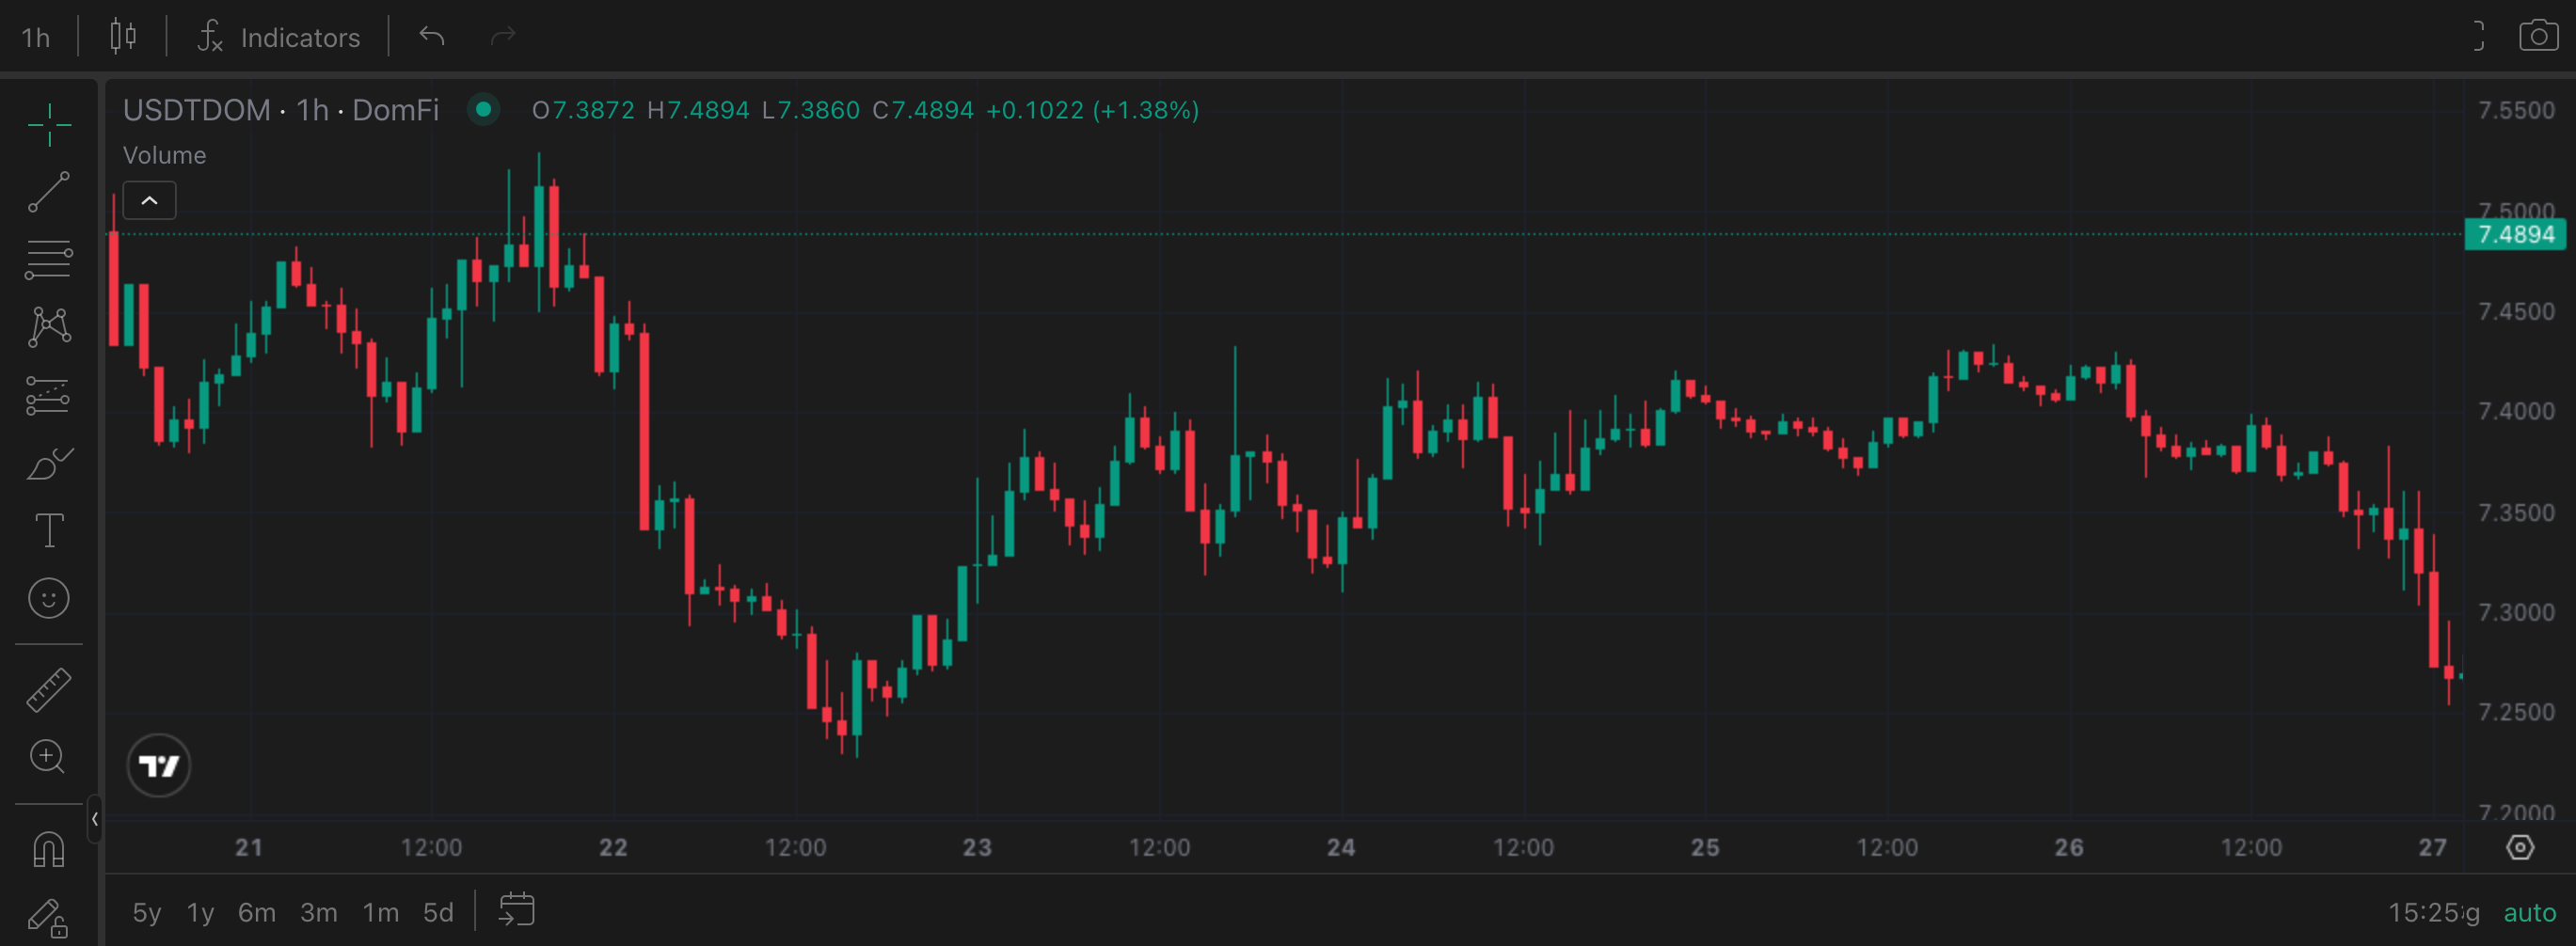
Last week closed at 7.57% with the 7.50% floor explicitly identified as the regime line. This week USDTDOM opened there and broke through it, reaching a weekly low of 7.23% before closing at 7.32%. The break is structurally meaningful: Tether Dominance is now printing lower-highs and lower-lows on the weekly chart from its cycle high near 7.88%, a contraction structure that aligns with risk appetite returning rather than a one-week aberration. The intraweek high of 7.57% was set on Monday open and never reclaimed, a clean bearish weekly candle with lower open, lower high, lower low, and lower close. The 7.20%–7.25% band is now the immediate structural test; a hold there with risk assets continuing to advance would confirm the new contraction range.
This Week’s Price Action
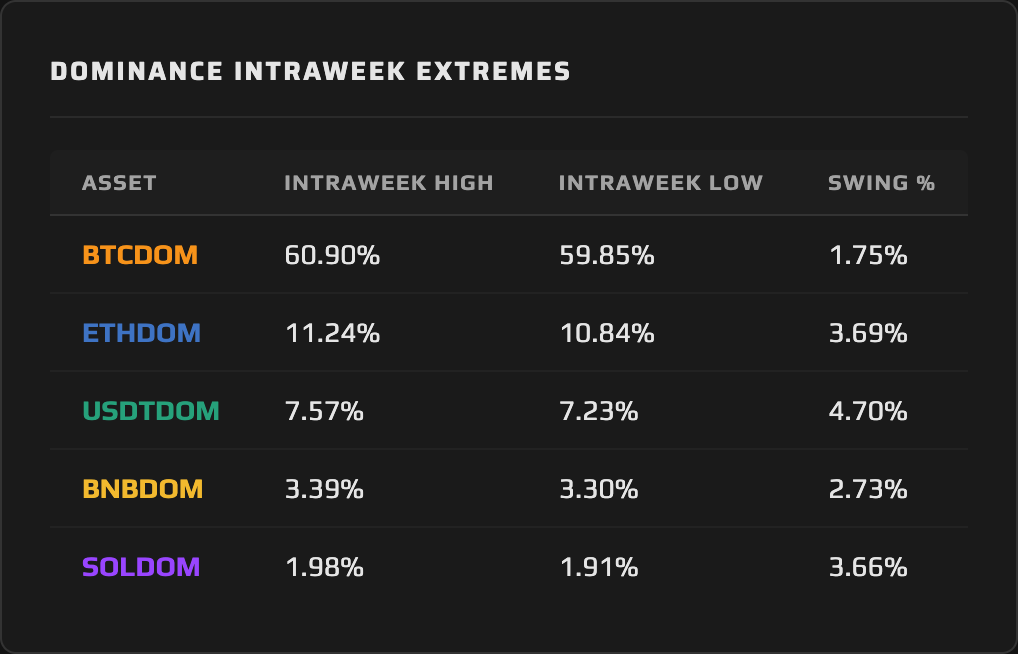
The open at 7.57% was the high. That tells you everything about the week’s directional conviction: from the first session, USDTDOM was under pressure. The move from 7.57% to 7.23% over the first three days reflected the Iran de-escalation catalyst translating directly into capital rotation out of the stablecoin position. The 4.76% intraweek swing between 7.57% and 7.23% is the largest of any dominance pair this week on a percentage-of-range basis — a reminder that USDTDOM, despite operating at levels that look “low” in absolute terms, carries real volatility that scales with regime shifts. A brief recovery toward 7.32% in the week’s second half held on the close as a minor geopolitical flare-up (the White House evacuation on April 26 briefly spiked BTC from $77,200 to $78,200) demonstrated that the defensive bid has not been fully extinguished. The recovery was small. The close held below every prior week’s floor.
The Daily View
The daily structure is a shallow recovery inside a declining weekly trend. USDTDOM compressed toward 7.23% by mid-week, then drifted back toward 7.32% across Thursday, Friday, and Saturday without generating meaningful momentum toward recovery. The pattern is consistent with capital that has made its directional decision — stablecoins out, risk assets in — and is not being recalled by fresh negative catalysts. The Saturday spike from the White House evacuation headline produced a brief pop in USDTDOM and a brief drop in BTC, both of which reverted within hours. That behavior is instructive: the fear-response reflex is still there, but it is losing duration. Each successive geopolitical shock is generating a shorter-lived defensive bid.
The Why
This is the most important distinction for USDTDOM this week: the dominance decline is not driven by stablecoin supply contraction. The stablecoin market cap was essentially flat across the week, moving from $318.88 billion to $318.77 billion, a $110 million decline that is statistical noise at the scale of the total complex. USDT itself hit a market cap ATH of $188 billion on April 21 — Tether’s supply was expanding, not contracting.
What compressed USDTDOM is the denominator. The total crypto market cap grew 4.96% from $2.450 trillion to $2.571 trillion, while stablecoin supply held flat. When risk assets appreciate faster than the stablecoin pile grows, every stablecoin dominance ratio declines mathematically. This is denominator expansion, not capital leaving stablecoins. USDT holders were not selling their USDT. Fresh capital arrived into risk assets via ETF inflows, Strategy’s direct purchase, and global institutional flows, growing the denominator while the numerator sat still.
The intra-stablecoin picture adds a layer that the headline USDTDOM number alone cannot reveal. USDT’s share of total stablecoins has declined from 60.46% to 57.96% year-to-date, while USDC has grown to $78.6 billion and continues taking share. USDT hit an ATH in absolute supply while simultaneously losing share within the stablecoin category. That is a dominance story within the dominance story: USDT is growing, but the stablecoin complex as a whole is growing faster, and USDC’s proportional gains are compressing Tether’s internal share. domination.finance currently tracks USDT as a standalone pair; the intra-stablecoin rotation visible here is precisely the kind of capital-behavior signal that a stablecoin-basket dominance instrument would isolate in real time.
The Outlook
The contraction structure is intact, and the catalysts that built it have not reversed. Three scenarios branch from the current 7.32% close. In the base case, BTC ETF inflows continue and macro conditions stay benign; USDTDOM drifts toward the 7.00%–7.20% band, which would be the lowest sustained level of the current cycle. In the bull-for-risk scenario, the FOMC holds steady Wednesday, Q1 GDP prints above expectations, and NFP Friday confirms labor market resilience — USDTDOM presses toward 7.00% or below. In the risk-off scenario, GDP disappoints sharply or a geopolitical shock arrives, USDTDOM snaps back toward 7.50%–7.57% quickly; the defensive bid remains coiled at those levels. The break below 7.50% is confirmed. The next level to watch is 7.00%.
4. THE DOMINANCE MATRIX
The four pairs outside this week’s deep dive — BTCDOM, ETHDOM, BNBDOM, and SOLDOM — describe a single structural fact: BTC is capturing the risk-on rotation, and everything else is absorbing the denominator expansion as a passive consequence.
BTCDOM is the week’s analytical centerpiece in the matrix. The 1.44% advance from 59.85% to 60.72% is the only dominance gain in the complex, and it is anything but mechanical. BTC’s price gained 6.48% against a total market advance of 4.96%, meaning BTC genuinely outperformed the broad complex rather than simply participating in a rising tide. That spread, price gain minus market cap gain, is the dominance expansion signal: BTC took a larger share of a larger market. The mechanism is specific. IBIT captured 91% of all ETF inflows in April. Strategy’s $2.54 billion purchase absorbed supply directly. A 46-day crowded short position unwound into a thin ask-side order book. These are institutional flows with a single destination, and BTCDOM reflects it. The close above 60% is not a threshold crossed in passing; the prior two issues explicitly tracked BTCDOM’s approach to that level, and last week’s intraweek high of 60.14% failed to close above it. This week’s 60.72% weekly close is confirmation, not continuation.
BNBDOM fell 1.79% from 3.36% to 3.30%, the largest percentage decline among the risk asset pairs and the matrix’s outlier. BNB’s price gained 3.20% — a real advance, but 1.76% below the total market’s 4.96% move. BNB’s market cap grew slower than the denominator. The gap is wider for BNB than for ETH or SOL, and the reason is capital concentration. In a week where 91% of ETF inflows went to BTC, and where institutional mandates are narrowing to BTC first and ETH second, BNB sits further from the flow. The Binance ecosystem has genuine utility and consistent volume, but those characteristics provide a structural floor rather than a catalyst for relative outperformance when BTC is absorbing the headline institutional bid. BNBDOM’s 2.64% intraweek swing (3.30% low to 3.39% high) shows that the bid existed early in the week, then receded as BTC concentration deepened.
ETHDOM (−0.57%) and SOLDOM (−0.61%) sit in a tight cluster that is almost identical at the weekly close level. The closeness of those numbers is coincidental rather than causal: the mechanisms behind each are distinct, and reading them as a coordinated move would miss the divergence in their forward setups. ETH gained 4.63% for the week, nearly matching the 4.96% market advance, which is why ETHDOM’s decline was contained to 0.57%. ETH is tracking the market almost proportionately. The institutional interest narrative — Glamsterdam upgrade approaching in June, staking ETFs in the pipeline, analyst calls for Q2 rotation — is providing a bid that keeps ETHDOM close to flat even when BTC is taking the dominant share. The 10.84% intraweek low held well above the 10.4%–10.5% cycle lows that threatened structural breakdown earlier in the cycle. ETHDOM’s 3.74% intraweek swing, the second-widest in the complex this week, reflects the volatility around that institutional uncertainty but not a breakdown. The pair is holding. The question is whether the Q2 catalysts are strong enough to convert “holding” into “gaining.”
Solana Dominance also fell 0.61%, from 1.94% to 1.93%, with SOL gaining 4.06% — close to the market advance but not quite matching it. SOLDOM’s 3.55% intraweek swing touched 1.98% at the high and 1.91% at the low, a range that represents genuine positioning activity around the 1.94% level without resolving in either direction. Solana ETFs now hold over $1 billion in combined AUM, a milestone that generated institutional attention in prior weeks but is not yet sufficient to drive SOLDOM expansion when the total market is moving at comparable speed. The ETF AUM is growing; the dominance ratio reflects that BTC’s ETF-driven growth is simply outpacing it.
Synthesis: This week’s dominance picture describes a risk-on rotation that is genuine but narrowly routed. Capital returned to crypto through the front door, via ETF flows concentrated in BTC, Strategy’s direct purchases, and the unwinding of the most extended short position since 2023. BTCDOM gained while every other risk asset pair declined, not because those assets are failing but because the institutional capital choosing crypto is choosing BTC first, second, and predominantly. USDTDOM’s break below 7.50% confirms the stablecoin-to-risk rotation is underway. The open question is whether that rotation broadens into ETHDOM and SOLDOM, or whether Bitcoin Dominance continues extending its lead as the cycle’s institutional concentration point.
5. THE WEEK AHEAD — EVENTS CALENDAR
Monday, April 27 — Bitcoin 2026 Conference opens, Las Vegas (35,000+ attendees, through April 29; SEC Chair Paul Atkins fireside chat) | HODL Summit 2026 opens, Dubai (through April 28)
Tuesday, April 28 — FOMC Meeting Day 1 | CB Consumer Confidence April (Prior: 86.0) | Jupiter (JUP) token unlock: 53.47M tokens (~$9.77M) | Sign (SIGN) token unlock: 401.1M tokens (~$7.05M, 20.78% of released supply)
Wednesday, April 29 — FOMC Rate Decision, expected hold at 3.50–3.75% | TOKEN2049 Dubai opens (through April 30, 15,000+ attendees)
Thursday, April 30 — Q1 GDP Advance Estimate (Prior Q4 2025: ~2.3%) | March PCE Price Index | Initial Jobless Claims (Prior: ~215K)
Friday, May 1 — April Nonfarm Payrolls (Prior: 178K) | ISM Manufacturing PMI | SUI token unlock: 42.62M tokens (~$40.39M)
What to Watch for Dominance: The FOMC decision Wednesday is the primary macro binary: a hold with a neutral statement sustains the risk-on regime and keeps USDTDOM below 7.50%, while any hint of hawkish pivot — either on rates or balance sheet policy — reactivates the defensive bid and could push Tether Dominance sharply back toward 7.50%–7.57% before the week closes. Thursday’s GDP advance estimate and PCE print arrive in the same session; a GDP miss alongside a hot PCE would be the stagflationary print that creates the most aggressive risk-off dominance response, potentially reversing the USDTDOM breakdown from this week in a single session. Bitcoin 2026 in Las Vegas, with SEC Chair Atkins appearing in a fireside format, carries the highest crypto-specific dominance potential: a definitive regulatory signal on spot BTC ETF expansion, staking ETF approvals, or market structure legislation could trigger fresh ETF flows and extend BTCDOM’s hold above 60%. On the unlock calendar, the SUI unlock Friday at $40.39M is the only event approaching a scale that could produce localized selling pressure, though it remains a SOL- and SOL-adjacent-ecosystem story rather than a broad SOLDOM catalyst.
6. CLOSING REMARK
The regime call from the last two issues is now confirmed. USDTDOM has broken below the 7.50% floor that had served as the cycle’s risk-appetite dividing line since March. BTCDOM has closed above 60% on a weekly basis for the first time this cycle. The stablecoin-to-risk rotation the prior week’s data telegraphed has arrived, and its mechanism is precisely what the dominance charts predicted: denominator expansion driven by institutional flows, not stablecoin supply contraction.
What the confirmation does not resolve is the concentration question. BTCDOM gaining while ETHDOM, BNBDOM, and SOLDOM all shed market share is a specific pattern: rotation into crypto, routed almost exclusively through BTC. Eight consecutive days of ETF inflows with 91% going to IBIT, a $2.54 billion Strategy purchase, 46 days of short positioning forced to unwind — none of these catalysts dispersed into the broader complex. They concentrated. Until Ethereum Dominance, Solana Dominance, or BNB Dominance can sustain a weekly gain alongside rising Bitcoin prices, the dominance charts are telling a BTC consolidation story inside a recovering market, not a full-cycle risk-on rotation. The next issue will be the first test of whether that changes.
This content is produced by domination.finance for informational and educational purposes only. Nothing contained herein constitutes financial or investment advice. Always conduct your own research.