Dominance Debrief #3
BNBDOM collapsed -3.95% on a Senate investigation into $1.7B in Iran-linked flows. ETHDOM surged +2.67% as Schwab's spot crypto launch approached. The market expanded — BNB couldn't join the party.
THE DOMINANCE DEBRIEF
Week of March 30 – April 5, 2026
Issue #3
TL;DR: BNBDOM collapsed -3.95% on a Senate investigation into $1.7B in Iran-linked flows. ETHDOM surged +2.67% as Schwab’s spot crypto launch approached. The market expanded — BNB couldn’t join the party.
1. THE WEEK IN DOMINANCE
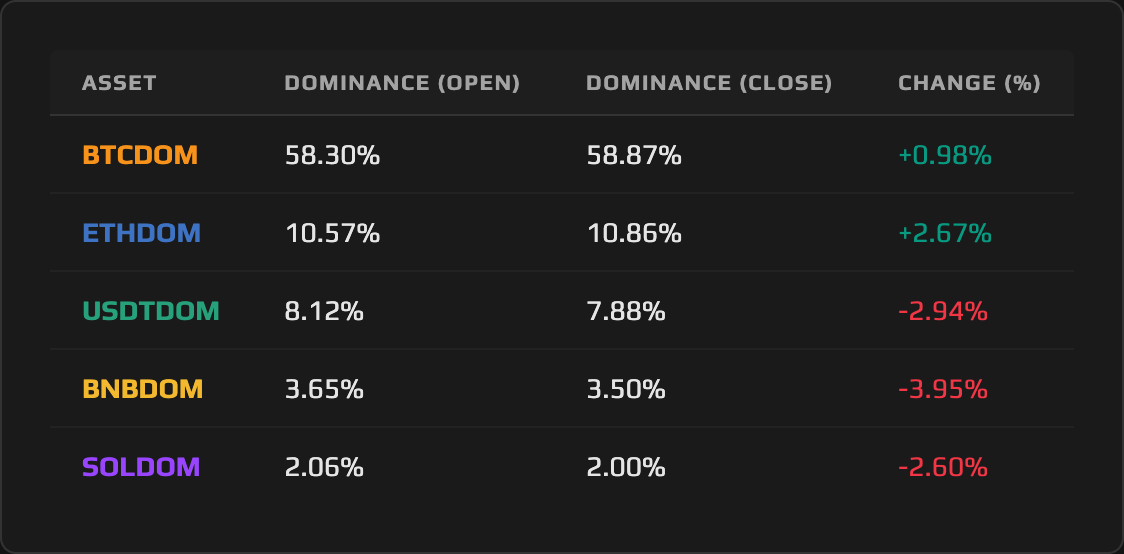
The defining dominance story of the week was a market that expanded and bifurcated simultaneously. The total crypto market cap climbed from roughly $2.25 trillion to $2.33 trillion, a gain of 3.6%. And yet BNB Dominance lost -3.95%, Tether Dominance fell -2.94%, and Solana Dominance declined -2.60%, all while Bitcoin Dominance edged higher and Ethereum Dominance surged. A rising market with diverging dominance curves is the signature of selective capital allocation, not broad participation: money moved into specific assets while others were punished by a combination of scandal, regulatory pressure, and structural weakness.
2. MACRO CONTEXT — THE BACKDROP
The total crypto market opened the week at approximately $2.25 trillion and closed near $2.33 trillion, a 3.6% expansion compressed into a five-day window that contained more macro signal than most full months. Equities recorded their best week in four months, with the S&P 500 gaining 3.4% and the Nasdaq adding 4.3%. The catalyst sequence was swift: Monday’s session opened on Iran de-escalation hopes and the S&P surged 2.91%, its best single-day performance since May. Tuesday’s JOLTS print of 6.882 million openings — down 358K, the weakest since 2020, signaling a softening labor market, which the Fed will eventually have to acknowledge. ISM Manufacturing printed 52.7, the fastest expansion since August 2022, with prices spiking to 78.3, the highest since June 2022. Wednesday brought Trump’s national address pledging to hit Iran “extremely hard” and announcing 100% tariffs on patented pharmaceutical imports on the anniversary of Liberation Day. WTI crude touched $110.21 per barrel. Markets recovered to close the day slightly positive. Thursday delivered the decisive data: NFP of +178K demolished the 59K consensus estimate, and initial jobless claims printed 202K against a 212K expectation. The labor market, whatever the JOLTS data implied, is not cracking.
Friday markets were closed for Good Friday, pausing CME futures trading and ETF creation and redemption. The partial trading week matters for interpreting the volume behind dominance moves, particularly in BNB, where the Blumenthal investigation broke Tuesday and the market had only three full sessions to process it.
The crypto-specific narrative overlay reinforced the week’s bifurcation. The Fear and Greed Index spent the entire week in Extreme Fear, ranging between 8 and 12, marking nearly 12 consecutive sub-15 days. BTC funding rates sat at the 6th percentile of their 30-day range, with negative prints on 25 of the last 30 eight-hour periods. The derivatives market was positioned overwhelmingly short, setting up a mechanical squeeze if any substantial catalyst arrived. That catalyst, when it came, did not lift the entire market uniformly. It lifted the assets that stood to benefit, and it left the ones with structural problems further behind.
3. ASSET DEEP DIVE
BNB (BNBDOM) Dominance
Open: 3.65% / Close: 3.50% / WoW Change: -3.95%
The Structure
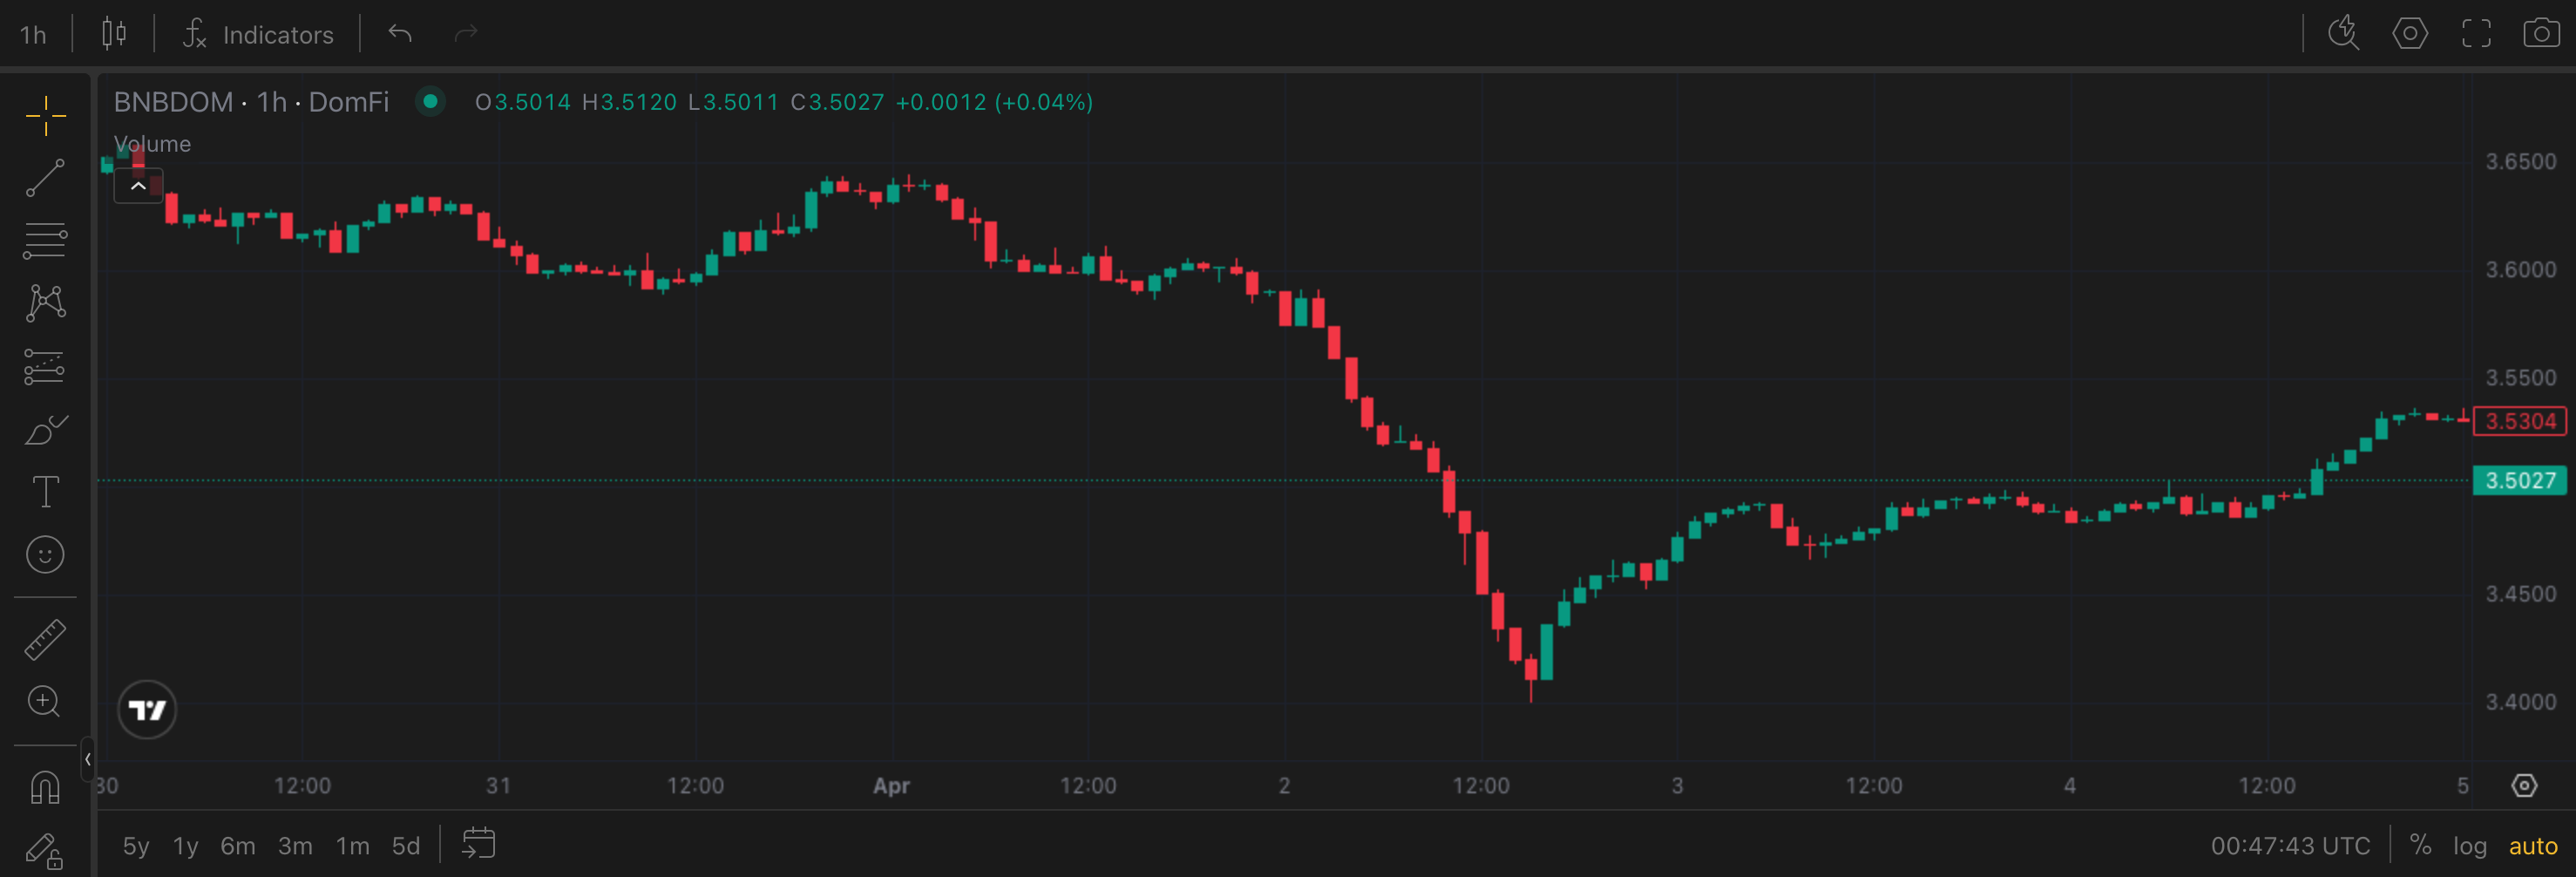
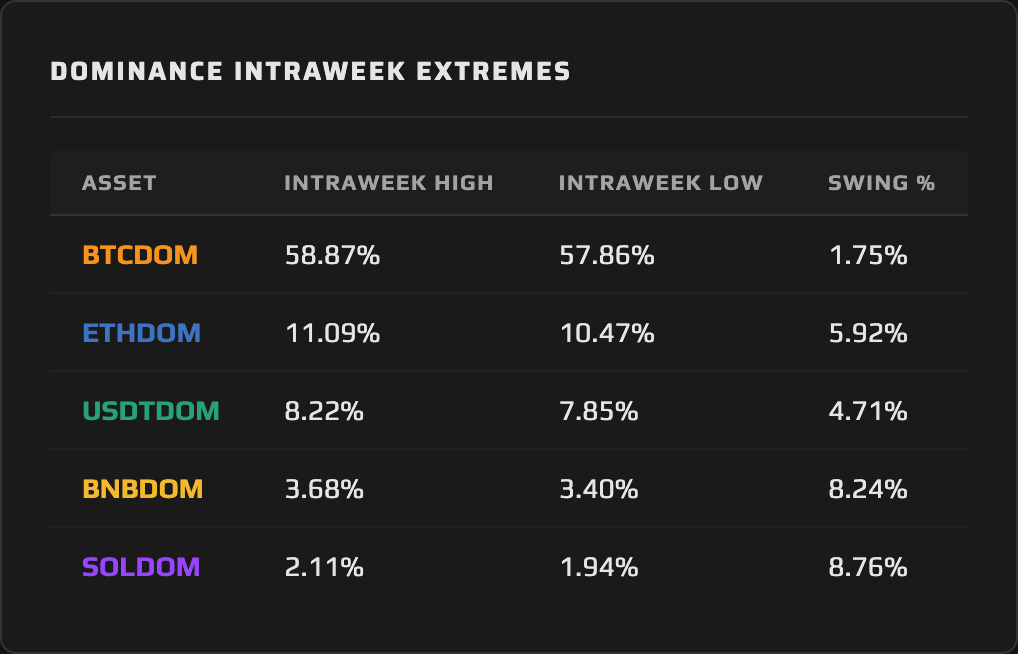
BNB Dominance entered the week at 3.65% in a structure that had already been under pressure since early March. The weekly candle closed at 3.50%, extending what is now a clear lower-high, lower-low sequence on the weekly dominance chart. The 3.50% level has acted as a structural line through the first quarter; a confirmed close beneath it shifts the dominant structure from compression to outright distribution. The intraweek extremes underscore the severity: BNBDOM ranged from a high of 3.68% to a low of 3.40%, producing a swing of 8.24% — the second-largest intraweek swing in this week’s dominance data. The 3.40% low was tested and held, but barely. That level is now the immediate floor; a retest with a close below it would accelerate the structural breakdown.
This Week’s Price Action
BNBDOM opened Monday at 3.65%, drifted higher to touch the intraweek high of 3.68% in the early part of the week before the Blumenthal investigation became public on April 1. The Tuesday-Wednesday leg saw a swift leg lower to the 3.40% area, where buyers absorbed the initial panic. The close at 3.50% represents a partial recovery, but the damage to the weekly structure is done. Crucially, BNB’s price declined -0.69% over the same period in which the total crypto market added 3.6% and BTC gained 4.57%. That combination — a declining BNB market cap against a total crypto market that added $80 billion — squeezed BNBDOM from both sides at once. BNB’s slice of the pie shrank while the pie itself grew. Both forces compound fast.
The Daily View
The daily dominance chart shows a sharp, catalyst-driven move on April 1, the day Senator Blumenthal’s letter to Binance became public. BNBDOM dropped from the 3.65%–3.68% range to the 3.40%–3.44% area in a single session, a directional move that was not preceded by any technical deterioration; it was event-driven and abrupt. The subsequent partial recovery to 3.50% reflects the market digesting the headline rather than fundamentally reassessing the situation. The daily structure shows no bullish divergence: each intraday recovery has printed a lower high, and momentum has not re-engaged on the buy side since the catalyst hit.
The Why
The proximate cause was Senator Richard Blumenthal’s April 1 letter pressing Binance over alleged $1.7 billion in Iran-linked transaction flows. Blumenthal gave Binance until April 14 to turn over records. The reaction in BNBDOM was immediate and disproportionate relative to the broader market. This is the catalyst-to-flow-to-dominance chain in its most direct form: a specific regulatory threat triggered outflows from BNB-denominated products and reduced demand for BNB as a fee and collateral token, compressing its market cap share at the exact moment the rest of the complex was expanding. Binance also delisted several BNB-paired trading instruments on April 2 (ALT/BNB and INJ/BNB among them), which structurally reduces the demand surface for BNB as a base asset in on-exchange transactions.
The dual mechanism bears explicit naming. BNB’s price fell -0.69% in a week when the broader market gained 3.6%. BNB’s market cap shrank in absolute terms while every major peer appreciated, shrinking its share of the total directly. At the same time, the total crypto market cap expanding from $2.25T to $2.33T made that share smaller still, because a growing total makes any stagnant or declining asset look worse by comparison. Both forces pushed in the same direction simultaneously. The result is a -3.95% dominance decline that reflects regulatory-driven capital avoidance, amplified by a rising market that had no interest in BNB’s problems.
The Outlook
The April 14 Binance records deadline is the governing binary for BNBDOM in the near term. If Binance delivers the requested records and the language from the Senate softens, the immediate overhang partially clears and BNBDOM can stabilize. The 3.50% level would then function as support, with a recovery toward 3.60%–3.65% as the base case. If Binance delays, challenges the request, or if additional regulatory actors join the inquiry, the pressure intensifies. In that scenario, the 3.40% intraweek low becomes a real test rather than a temporary wick, and a close below it would be the first structural break in the current cycle. Watch the April 14 deadline as the first resolution point; no meaningful technical recovery is likely until that overhang either resolves or the market decides to look through it.
4. THE DOMINANCE MATRIX
The remaining four pairs split into two clear groups: one asset gained against a rising market, one roughly tracked it, and two compressed despite the market expanding. That split is the analytical story.
The Gainer: ETHDOM
Ethereum Dominance was the week’s standout, gaining +2.67% from 10.57% to 10.86%. In a week where the market expanded, ETHDOM’s rise means ETH’s price gained faster than the market: ETH closed up 6.35% in price terms, the best price performance of any tracked asset. The catalyst-to-flow-to-dominance chain here runs through two specific events. First, EthCC ran March 30 through April 2 in Cannes, where discussion of the Glamsterdam upgrade (June 2026 target) and the naming of the subsequent Hegota upgrade kept institutional attention focused on ETH’s roadmap. Second, spot ETH ETF inflows were meaningful: a single-day net flow of $169M hit on Thursday, the largest in nearly two months, driven by 14,488 ETH in new accumulation. ETH exchange reserves simultaneously hit a yearly low of 14.9M ETH, while 3.4 million ETH sat in the staking validator queue, representing 60 days of supply locked away from exchange circulation. The intraweek high touched 11.09% before a partial pullback to close at 10.86%. The 11.09% high is now the level to watch; a weekly close above it would mark the highest ETHDOM reading since early March and formally extend the structure into a new range.
The Index-Tracker: BTCDOM
Bitcoin Dominance edged higher by +0.98%, from 58.30% to 58.87%. Against a market that expanded 3.6%, this is essentially a neutral result: BTC gained 4.57% in price terms, tracking just above the aggregate market return, leaving its share of the total roughly intact. The intraweek structure shows a range from 57.86% to 58.87%, a swing of just 1.74% — the tightest intraweek range of any tracked pair and a signal of relative stability. BTC exchange reserves remain at a 7-year low of 2.21M BTC, and whale addresses (1,000+ BTC) accumulated approximately 91,000 BTC over the trailing 90 days. Neither figure drove a dominance breakout this week, but both argue against a structural breakdown. BTCDOM is range-bound between 57.86% and 59.20%; the next directional move depends on whether macro risk appetite remains constructive through the CPI print and the Hormuz ultimatum expiry in the week ahead.
The Compressors: USDTDOM and SOLDOM
USDTDOM and SOLDOM both declined in a rising market, but through mechanisms that are categorically distinct. Tether Dominance fell -2.94%, from 8.12% to 7.88%. In a market expansion week, this is precisely the expected behavior: capital rotated out of the safe-haven stablecoin position and into risk assets as the S&P surged and crypto followed. The stablecoin aggregate market cap grew from $314.76B to $316.20B (+$1.44B), but that aggregate growth does not tell the full USDT story. USDT’s aggregate supply actually contracted by roughly $3 billion during Q1 2026, its first quarterly contraction since Q2 2022, while USDC gained market share within the stablecoin complex. The USDTDOM decline this week is therefore a composite signal: genuine risk-on rotation compressing the stablecoin share, inside which USDT is losing ground to USDC at the category level. That intra-stablecoin rotation is a dominance story within the dominance story: capital moving into risk and repositioning within the stablecoin complex toward USDC.
Solana Dominance declined -2.60%, from 2.06% to 2.00%, and the story here is the Drift Protocol exploit. On April 1, $285 million was drained from Drift, Solana’s largest decentralized perpetuals exchange, in what investigators suspect is a DPRK-linked operation — the largest DeFi hack of 2026 by a significant margin. The DRIFT token collapsed 41%. The direct dominance effect runs through two channels: first, the exploit destroyed on-chain value denominated in the Solana ecosystem, compressing the SOL market cap share; second, it damaged the narrative around Solana as institutional-grade DeFi infrastructure at precisely the moment when that narrative had been building toward the EthCC conference on Ethereum’s side. SOL’s price gained only 0.60% for the week, dramatically underperforming BTC (+4.57%) and ETH (+6.35%). SOLDOM’s intraweek swing of 8.76%, the largest of any tracked pair, captures the volatility around the exploit’s initial disclosure and subsequent partial recovery. The 2.00% close is the weakest weekly SOLDOM print since early March; the 1.94% intraweek low now functions as the structural floor.
Synthesis: The full dominance picture this week describes a bifurcated expansion: the market grew, but the gains concentrated sharply. ETHDOM and BTCDOM both gained. BNBDOM, USDTDOM, and SOLDOM compressed, each through a distinct mechanism: regulatory scandal, normal risk-on rotation, and a catastrophic DeFi exploit, respectively. Shared direction, different causation. That heterogeneity is the market’s signal: this was selective risk-taking, not a broad market re-rating.
5. THE WEEK AHEAD — EVENTS CALENDAR
Sunday, April 6 — Fed Vice Chair Philip Jefferson speech on “Economic Outlook and the Labor Market.”
Monday, April 7 — Trump’s Strait of Hormuz 48-hour ultimatum expires (8:00 PM ET) | Fed Governor Michael Barr discussion on “AI and Consumer Issues” | Solana Online Hackathon begins (runs through May 11).
Tuesday–Wednesday, April 7–8 — TEAMZ Web3 & AI Summit, Tokyo (Justin Sun, Tether’s Subash, Japan Finance Minister).
Wednesday, April 9 — FOMC Minutes from March 17–18 meeting (2:00 PM ET) | Roman Storm / Tornado Cash oral arguments on Rule 29 motion for acquittal.
Wednesday–Saturday, April 9–12 — BitBlockBoom Bitcoin conference, Fort Worth, TX.
Thursday, April 10 — CPI (March): Headline MoM consensus ~0.9% (prior 0.3%), YoY consensus ~3.2–3.4% (prior 2.4%), Core MoM consensus ~0.3% (prior 0.2%), Core YoY ~2.6–2.7% (prior 2.5%) | Initial Jobless Claims (prior 202K) | UMich Consumer Sentiment prelim (prior 53.3) | Deribit weekly BTC/ETH options expiry (~$1.8B est. notional) | Section 122 Tariff oral arguments at Court of International Trade.
Saturday–Sunday, April 11–12 — MIT Bitcoin Expo, Cambridge, MA.
Saturday, April 12 — Aptos (APT) token unlock: 11.3M APT (~$56.5M, 0.68% of circulating supply, community allocation).
What to Watch for Dominance: Thursday’s CPI print is the week’s highest-stakes release. It is the first CPI to reflect energy costs under the Strait of Hormuz shock. If headline MoM clears 1.0% or YoY approaches 3.5%, the Fed tightening narrative reasserts and stablecoin dominance catches a safe-haven bid, with USDTDOM likely recovering toward 8.00% and BTCDOM facing renewed headwinds. A CPI in line or below consensus keeps the risk-on tone intact and allows ETHDOM to press toward the 11.09% intraweek high as the technical target. The Hormuz ultimatum expiry on Monday is the geopolitical wildcard: any escalation re-prices crude, equities, and crypto risk simultaneously, and the dominance response would mirror what played out the week of March 16: USDTDOM surges, risk assets compress. The Tornado Cash oral arguments on Wednesday carry a secondary signal for ETHDOM: a favorable ruling removes a layer of smart contract regulatory risk and could support ETH-denominated DeFi flows at the margin.
6. CLOSING REMARK
The week of March 30 clarified something important about where we are in this cycle. A market that expands 3.6% while BNBDOM, USDTDOM, and SOLDOM all finish red is telling you that risk appetite has returned, but that it has grown selective. Capital that rushed for safety two weeks ago is now redeploying — but only into names with clean regulatory profiles and credible institutional narratives. Ethereum Dominance surging on ETF inflows and protocol momentum while BNB Dominance collapsed on a Senate investigation is not a coincidence. It is the market pricing institutional legitimacy as a first-order factor in dominance allocation.
The next test of that thesis arrives Thursday. A hot CPI print would challenge the rotation’s durability, pushing rates expectations higher and stablecoin dominance back toward the 8% range. A clean print sustains the regime. What the dominance charts will reveal, regardless of which way macro resolves, is whether the bifurcation deepens or whether the market finds reasons to bring the laggards back into the expansion. The evidence from this week argues for deepening. The Binance investigation has a deadline, not a resolution. The Drift exploit has no timeline at all.
This content is produced by domination.finance for informational and educational purposes only. Nothing contained herein constitutes financial or investment advice. Always conduct your own research.