Dominance Debrief #14
A hawkish Fed broke the week risk-off and capital ran to cash, lifting USDTDOM +2.99%. SOLDOM defied the tape at +4.84%, riding SOL as the only major to gain. The tell sits underneath: Bitcoin Dominance slipped -0.76% and failed to play safe-haven.
THE DOMINANCE DEBRIEF
Week of June 15 – June 21, 2026
Issue #14
TL;DR: A hawkish Fed broke the week risk-off and capital ran to cash, lifting USDTDOM +2.99%. SOLDOM defied the tape at +4.84%, riding SOL as the only major to gain. The tell sits underneath: Bitcoin Dominance slipped -0.76% and failed to play safe-haven.
1. THE WEEK IN DOMINANCE
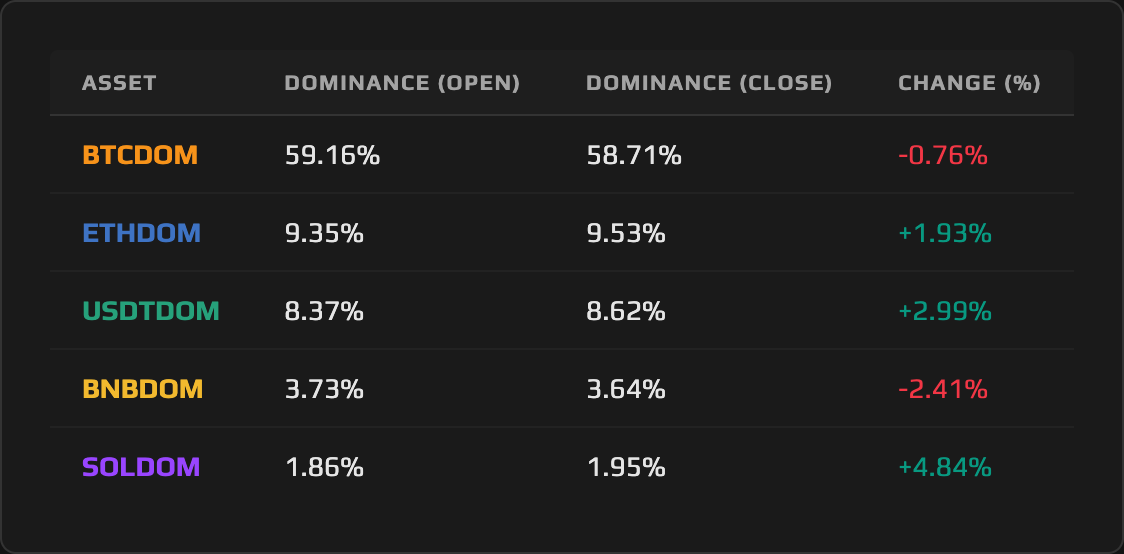
The week split cleanly in two. An early relief bounce, fed by hopes of US–Iran de-escalation, lifted sentiment off the floor and pressed stablecoin share down to its weekly low. Then Wednesday’s Federal Reserve decision landed with a hawkish dot plot, and the bid evaporated. By Sunday’s close the total crypto market had shed roughly 3%, capital had retreated into cash, and Tether Dominance had climbed +2.99% to 8.62%. The loudest line on the board, though, was not the flight to safety. It was Solana Dominance posting +4.84% to 1.95%, the largest move of any pair, while the rest of the risk complex bled or stalled. Beneath both ran a quieter anomaly: Bitcoin Dominance slipped -0.76% and did not absorb the safety bid that a textbook risk-off week is supposed to send its way.
2. MACRO CONTEXT — THE BACKDROP
The total crypto market cap opened the week near $2.21 trillion and closed near $2.14 trillion, a contraction of roughly 3%. That decline was the engine lifting stablecoin dominance and punishing the assets that fell faster than the market around them. On the price side, the dispersion told the story: SOL was the only major to finish higher at +1.72%, ETH held up best among the decliners at -1.16%, BTC fell -3.78%, and BNB took the worst of it at -5.30%. USDT’s peg held near $1.00 throughout, drifting only to $0.9988 by Sunday, immaterial to the dominance read.
The first half of the week argued the other way. Crypto Fear & Greed, which had bottomed near 8 the prior week, recovered to roughly 20 by Monday and ticked to 24 by Wednesday as hopes of US–Iran de-escalation took some risk premium out of the tape. Bitcoin pressed back toward $65,000, altcoins firmed, and USDTDOM sank to its weekly low of 8.13% as cash got redeployed. The setup looked like the start of a relief leg.
Wednesday, June 17 ended it. The Federal Reserve held the funds rate at 3.50%–3.75% on a unanimous 12-0 vote, a decision markets had priced. What they had not priced was the dot plot. The 2026 median projection was lifted to 3.8%, signaling no cuts and a tilt toward hikes: of the eighteen officials, one penciled in a cumulative 75 basis points of additional tightening this year, five favored 50, three favored 25, eight held flat, and a single dot looked for a 25 basis point cut. The Committee also raised its 2026 headline PCE forecast to 3.6%, well above the 2.7% it carried in March. In Chair Warsh’s first meeting at the helm, the message was solid expansion alongside persistent inflation, and against a March baseline that had still implied one cut this year, that read as a hawkish surprise. Risk repriced in real time.
The dominance charts captured the pivot to the hour. USDTDOM, sitting at its 8.13% low into the decision, spiked toward its 8.71% weekly high as the flight to cash took hold. Solana Dominance sold off to its 1.84% low across June 18–19 before the recovery began. By Sunday, Fear & Greed had settled at 22, pinned in extreme fear for the full week despite the early bounce. The relief leg was real for about two days; the Fed took the rest.
3. ASSET DEEP DIVE
Solana (SOL) Dominance
Open: 1.86% / Close: 1.95% / WoW Change: +4.84%
The Structure
Solana Dominance entered the week at 1.86%, precisely where it had closed the prior week, with 1.90% standing as the level a sustained move would need to clear to confirm a breakout of the recent range. This week it cleared it. SOLDOM closed at 1.95%, comfortably above 1.90%, reclaiming the level that had capped the range and turning the prior overhead into a launch point. The 1.98% intraweek high now reads as the proximate resistance, with the round 2.00% figure sitting just above it as the next psychological test. The reclaim is the structural headline: a breakout that holds into the weekly close carries more weight than one that prints intraweek and fades.
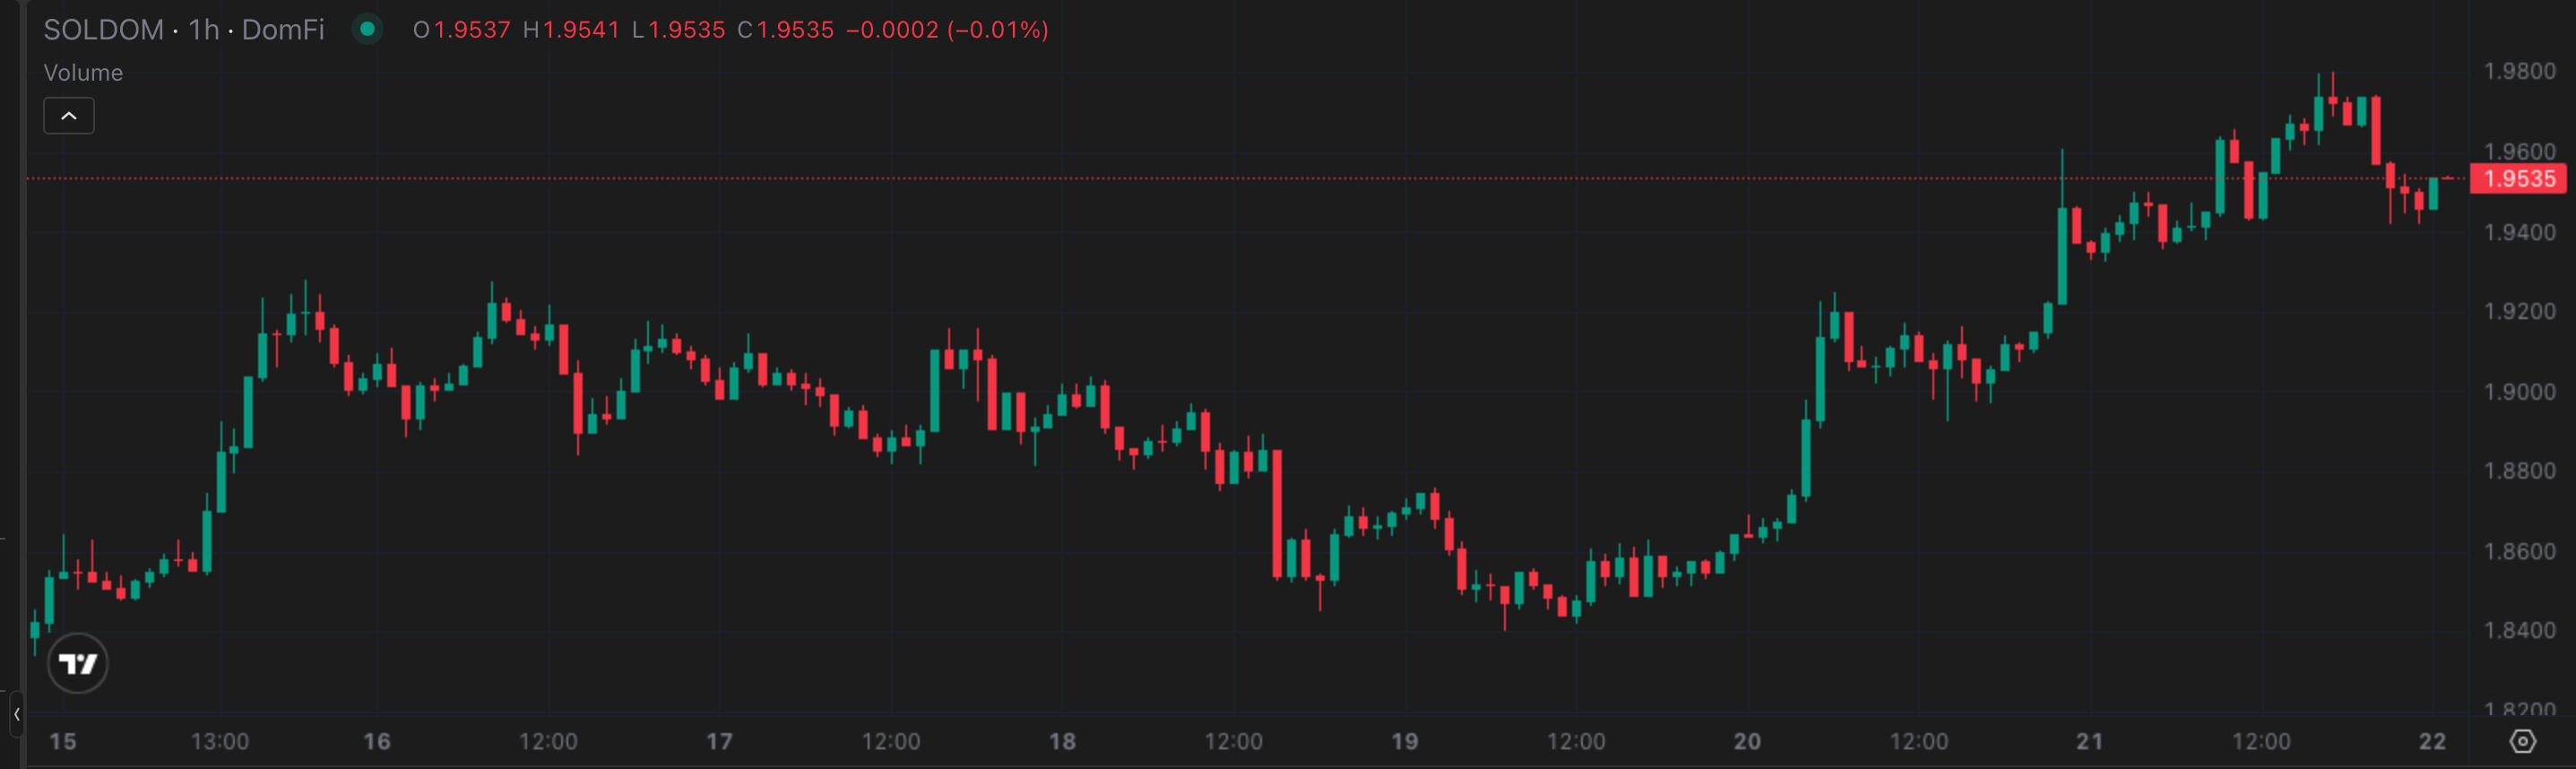
This Week’s Price Action
The weekly candle opened at 1.86%, dipped to 1.84% during the post-Fed selloff, and recovered to close at 1.95%, just under the 1.98% peak. The swing across that 1.84%–1.98% range was 7.61%, the widest of any pair this week and a measure of how violently SOL’s relative share repriced around the macro shock. The decisive read is the location of the close: SOLDOM finished near its high, not its low, which says sellers showed up midweek and were overwhelmed by the back-half bid.
The Daily View
On the daily frame, SOLDOM traces a clean V. Early week it held its open while the relief bounce played out. The hawkish dot plot then drove the flush to 1.84% across June 18–19, the deepest point of the week. From there each subsequent session printed higher, and the recovery accelerated into Saturday and Sunday, carrying SOLDOM through its 1.86% open, through 1.90%, and up to the 1.98% high before the 1.95% close. The momentum turn is unambiguous on the chart: the low held, the recovery was orderly, and buyers, not sellers, controlled the weekend.
The Why
The catalyst stack behind Solana’s outperformance was the most defined of any asset this week, and it explains how SOL gained price while the rest of the complex fell. The Solana Policy Institute’s “Washington x Wall Street” summit, held June 16, put a policy-credibility narrative directly in front of institutional allocators in the same window the macro tape was turning hostile. That sat on top of an existing institutional-legitimacy bid from CME’s cash-settled Crypto Index Futures, which include SOL alongside BTC and ETH and open a regulated exposure channel that does not require spot custody. The Alpenglow upgrade, targeting Q3 mainnet, supplied the roadmap layer underneath. None of these on its own moved the price, but together they were a significant factor in insulating SOL from the selling that hit everything around it.
The dominance mechanics then compounded the move. SOL’s price gained +1.72%, so Solana’s own market value expanded, while the total crypto market contracted roughly 3%. An asset growing while the market it sits inside shrinks is the cleanest setup for a dominance gain, and capital fleeing other risk assets, along with stablecoin-parked dry powder hunting a relative outperformer, amplified it beyond what the +1.72% price move alone would suggest. The result was the board’s largest dominance gain in a week almost everything else lost ground.
The Outlook
The path forward hinges on Friday’s Core PCE. The bull case is a cool print that takes some sting out of the hawkish dot plot and lets SOLDOM hold its reclaim of 1.90%, pressing toward the 1.98% high and the 2.00% level above it, with the summit and CME-futures narratives keeping the institutional bid in place. The bear case is a hot print that confirms higher-for-longer, reignites the flight to cash, and sends Solana Dominance back to retest the 1.84% low. The Deribit quarterly expiry the same day adds volatility to whichever direction the data sets. The level to watch is 1.90%: hold it and the breakout is real, lose it and this was a relief rally inside a risk-off tape.
4. THE DOMINANCE MATRIX
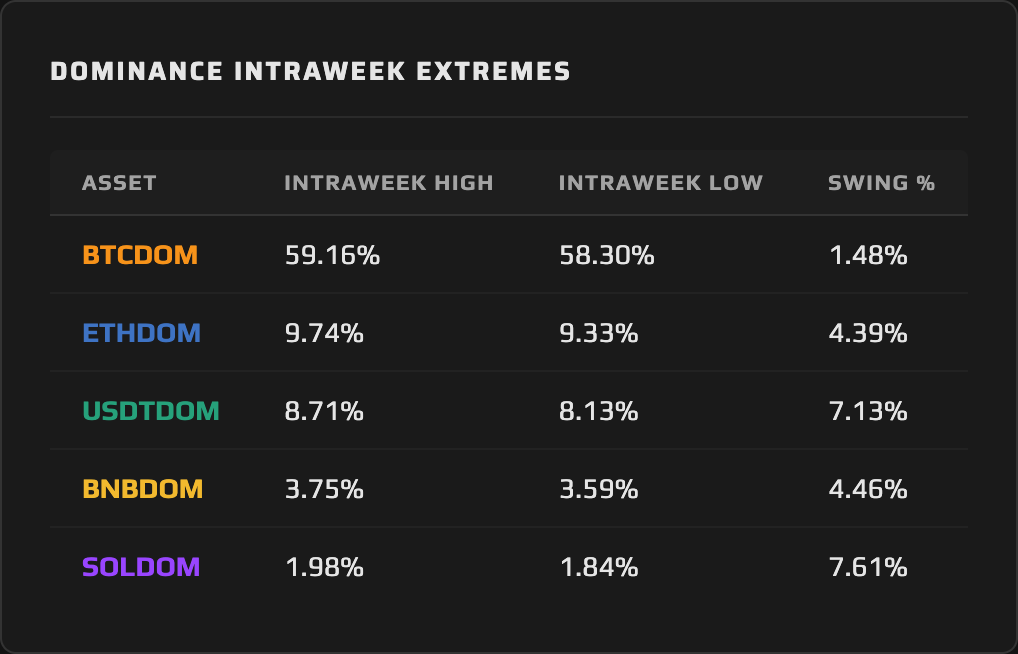
Tether Dominance is the matrix’s biggest mover and the sharpest read of the week’s character, climbing +2.99% from 8.37% to 8.62%. Its 7.13% swing, from an 8.13% low to an 8.71% high, was the widest of this group and encodes the week’s pivot in a single number. The 8.13% low printed early, when the relief bounce had capital redeploying out of cash; the 8.71% high came in the post-Fed flight to safety. Aggregate stablecoin supply was roughly steady across the week, so the rise in USDTDOM came from the total market contracting around 3% while that cash sat still. The spike to 8.71% and the 8.62% close mark almost to the hour when fear entered and where it settled. The dominance lens also surfaces a layer beneath the headline, the rotation among stablecoins themselves, a dynamic that becomes its own signal as share shifts within the cash complex rather than only between cash and risk.
BNB Dominance was the week’s heaviest faller at -2.41%, sliding from 3.73% to 3.64%. BNB was the worst-performing major in price at -5.30%, dropping faster than the roughly 3% market decline, so BNB Dominance was squeezed from both sides at once: its own market value shrank while the market it sits within also contracted, and BNB shrank faster. Its 4.46% swing, from a 3.59% low to a 3.75% high, reflects a pair that found no bid as the macro tape soured.
Ethereum Dominance ran the other way, adding +1.93% from 9.35% to 9.53%. ETH fell only -1.16%, far less than the market around it, and that relative resilience is exactly what lifts share in a down week: hold value better than the market and dominance rises even as price falls. ETHDOM’s 4.39% swing, from a 9.33% low to a 9.74% high, shows the volatility was there, but the directional outcome was a defensive gain, ETH behaving as the steadier hand among the majors.
Bitcoin Dominance is the analytically loudest line precisely because of what it did not do. In a risk-off week, it slipped -0.76% from 59.16% to 58.71%. BTC fell -3.78%, harder than the roughly 3% decline in the broad market, so it shed a sliver of share rather than gaining it. The safe-haven-within-crypto bid did not arrive; the safety flow went to cash, and USDTDOM captured it instead. BTCDOM’s 1.48% swing was the tightest of any pair, its 59.16% high equal to the open and its 58.30% low marking the week’s floor, a narrow band that says Bitcoin neither led the selloff nor defended against it. It tracked lower with the tape.
Synthesis: This was a risk-off-to-cash week, but not a uniform one. Tether Dominance rose on the flight to safety, BNB Dominance led the losers as its price cracked, and Ethereum Dominance gained on relative resilience. The two anomalies are what give the week its texture: Bitcoin Dominance failed to act as the safe harbor, and Solana Dominance bucked the tape entirely on its own catalysts. The regime turns risk-on when BTCDOM gains while USDTDOM contracts. That reversal did not arrive this week.
5. THE WEEK AHEAD — EVENTS CALENDAR
Monday, June 22 — Dutch Blockchain Week 2026 begins in Amsterdam (running through June 28) | Litecoin Summit 2026, Amsterdam (June 22–23).
Thursday, June 25 — US Final Q1 GDP (consensus +1.6%) | Initial Jobless Claims (consensus 225K) | Advance Durable Goods Orders, May (consensus +0.2%).
Friday, June 26 — US Personal Income & Outlays, May, including Core PCE Price Index, the Fed’s preferred inflation gauge (consensus +0.1% to +0.2% MoM, +2.6% YoY), Personal Income (consensus +0.4%), and Personal Spending | Deribit Q2 quarterly BTC and ETH options expiry, the largest settlement of the quarter at roughly 24% of total open interest | Sahara AI (SAHARA) token unlock: approximately 1.03 billion tokens, around 9.58% of circulating supply.
What to Watch for Dominance: Friday is the pivot. Core PCE is the first major inflation read since the hawkish dot plot, and it will either confirm or relieve the higher-for-longer repricing that set this week’s tone. A hot print extends the flight to cash, with Tether Dominance pressing above 8.62% while Bitcoin Dominance stays soft; a cool print revives the risk bid and gives Solana Dominance room to defend its reclaim of 1.90%. The Deribit quarterly expiry the same day is large enough to move spot across the majors in a single session, which mechanically shifts every dominance ratio on the board. The cleanest tell is SOLDOM: hold above 1.90% and the breakout is durable, fade back into the prior range and the move reads as a relief rally the macro tape reclaims.
6. CLOSING REMARK
The confirmation round teed up the prior week arrived Wednesday, and it broke the wrong way for risk. The Federal Reserve held rates but raised its dots and its inflation forecast, and a market that had spent two days pricing a relief bounce gave it all back. The dominance charts recorded the verdict with precision: Tether Dominance climbed +2.99% to 8.62% as capital ran to cash, Bitcoin Dominance slipped -0.76% and failed to defend as the selling hit BTC directly, and the safety flow that a risk-off week usually routes through Bitcoin went to stablecoins instead.
The one asset that refused the regime was Solana. SOLDOM’s +4.84% gain, built on the only positive price move among the majors, reclaimed 1.90% and closed near its high while everything around it fell. Whether it holds is the question Friday answers. Core PCE and the quarterly expiry land on the same day, and between them they will decide if the flight to cash deepens or unwinds. Until then the read is plain: 8.62% on USDTDOM is the level that says fear is still in control, and 1.90% on SOLDOM is the level that says one corner of the market is not listening.
This content is produced by domination.finance for informational and educational purposes only. Nothing contained herein constitutes financial or investment advice. Always conduct your own research.