Dominance Debrief #21
SOLDOM led the board at +2.54%, erasing four days of losses in the final 60 hours. USDTDOM fell hardest at −1.65%. BTCDOM and BNBDOM matched gains through opposite paths; ETHDOM slipped despite ETH's price rising.
THE DOMINANCE DEBRIEF
Week of August 3 – August 9, 2026
Issue #21
TL;DR: SOLDOM led the board at +2.54%, erasing four days of losses in the final 60 hours. USDTDOM fell hardest at −1.65%. BTCDOM and BNBDOM matched gains through opposite paths; ETHDOM slipped despite ETH’s price rising.
1. THE WEEK IN DOMINANCE
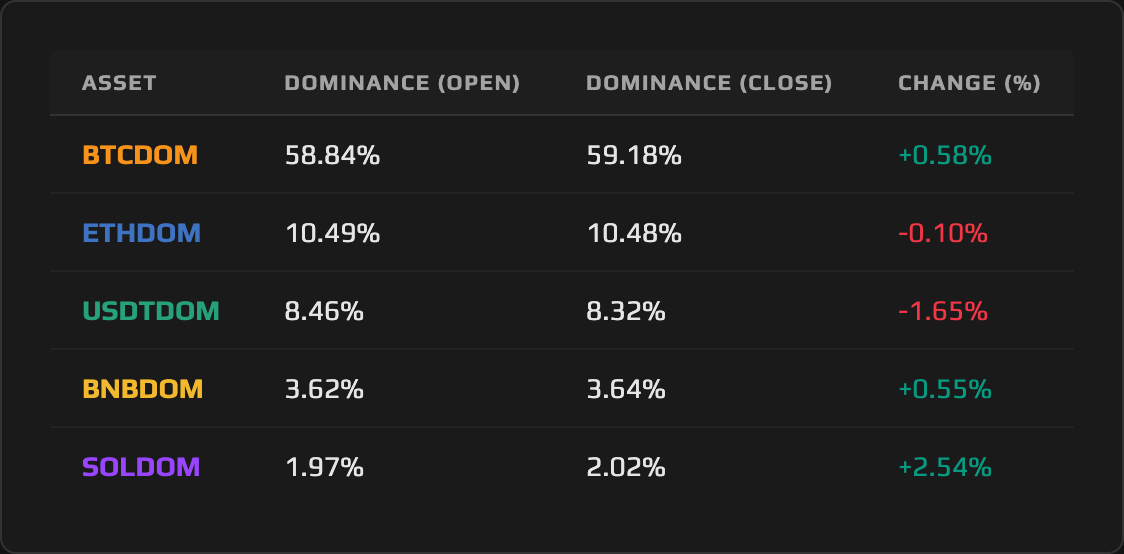
Solana Dominance posted the largest move on the board this week, gaining 2.54% to close at 2.02%, but it did so entirely in the final 60 hours after spending the first four days grinding down to a 1.93% low. Bitcoin Dominance and BNB Dominance arrived at almost identical gains, 0.58% and 0.55%, by opposite routes: BTCDOM peaked Friday and eased into the weekend while BNBDOM bottomed Friday and rallied into it. Ethereum Dominance slipped 0.10% even though ETH’s price rose on the week, and Tether Dominance fell hardest of all, down 1.65%, as the cash pile lost ground to a market that expanded faster than it did.
2. MACRO CONTEXT — THE BACKDROP
Total crypto market cap expanded 1.59% over the week, the number every dominance outcome below is measured against. Every asset that beat that pace gained dominance; every asset that lagged it, including the ones still up in price, lost it. That single comparison is the spine of this issue.
The week’s pivot arrived Friday, August 7, when the July jobs report showed 23,000 jobs lost. Crypto prices moved higher after the print, splitting the week cleanly into a soft first half and a firmer second half. Two days earlier, the Senate had declined to bring the CLARITY Act to a floor vote before its August recess, with Majority Leader Thune deferring action until lawmakers return on September 14. The market absorbed that regulatory disappointment and rallied through it rather than on it, a resilience worth registering without overreading.
The Fear & Greed Index sat at 52, Neutral, as of Sunday, August 9, consistent with a week that expanded broadly without tipping into euphoria. None of this macro backdrop explains any single pair’s move on its own; a market-wide print moves the whole complex, and dominance measures what happens on top of that, which is where the real story of this week sits.
3. ASSET DEEP DIVE
Solana (SOL) Dominance
Open Price: 1.97% / Close Price: 2.02% / WoW Change: +2.54%
The Structure
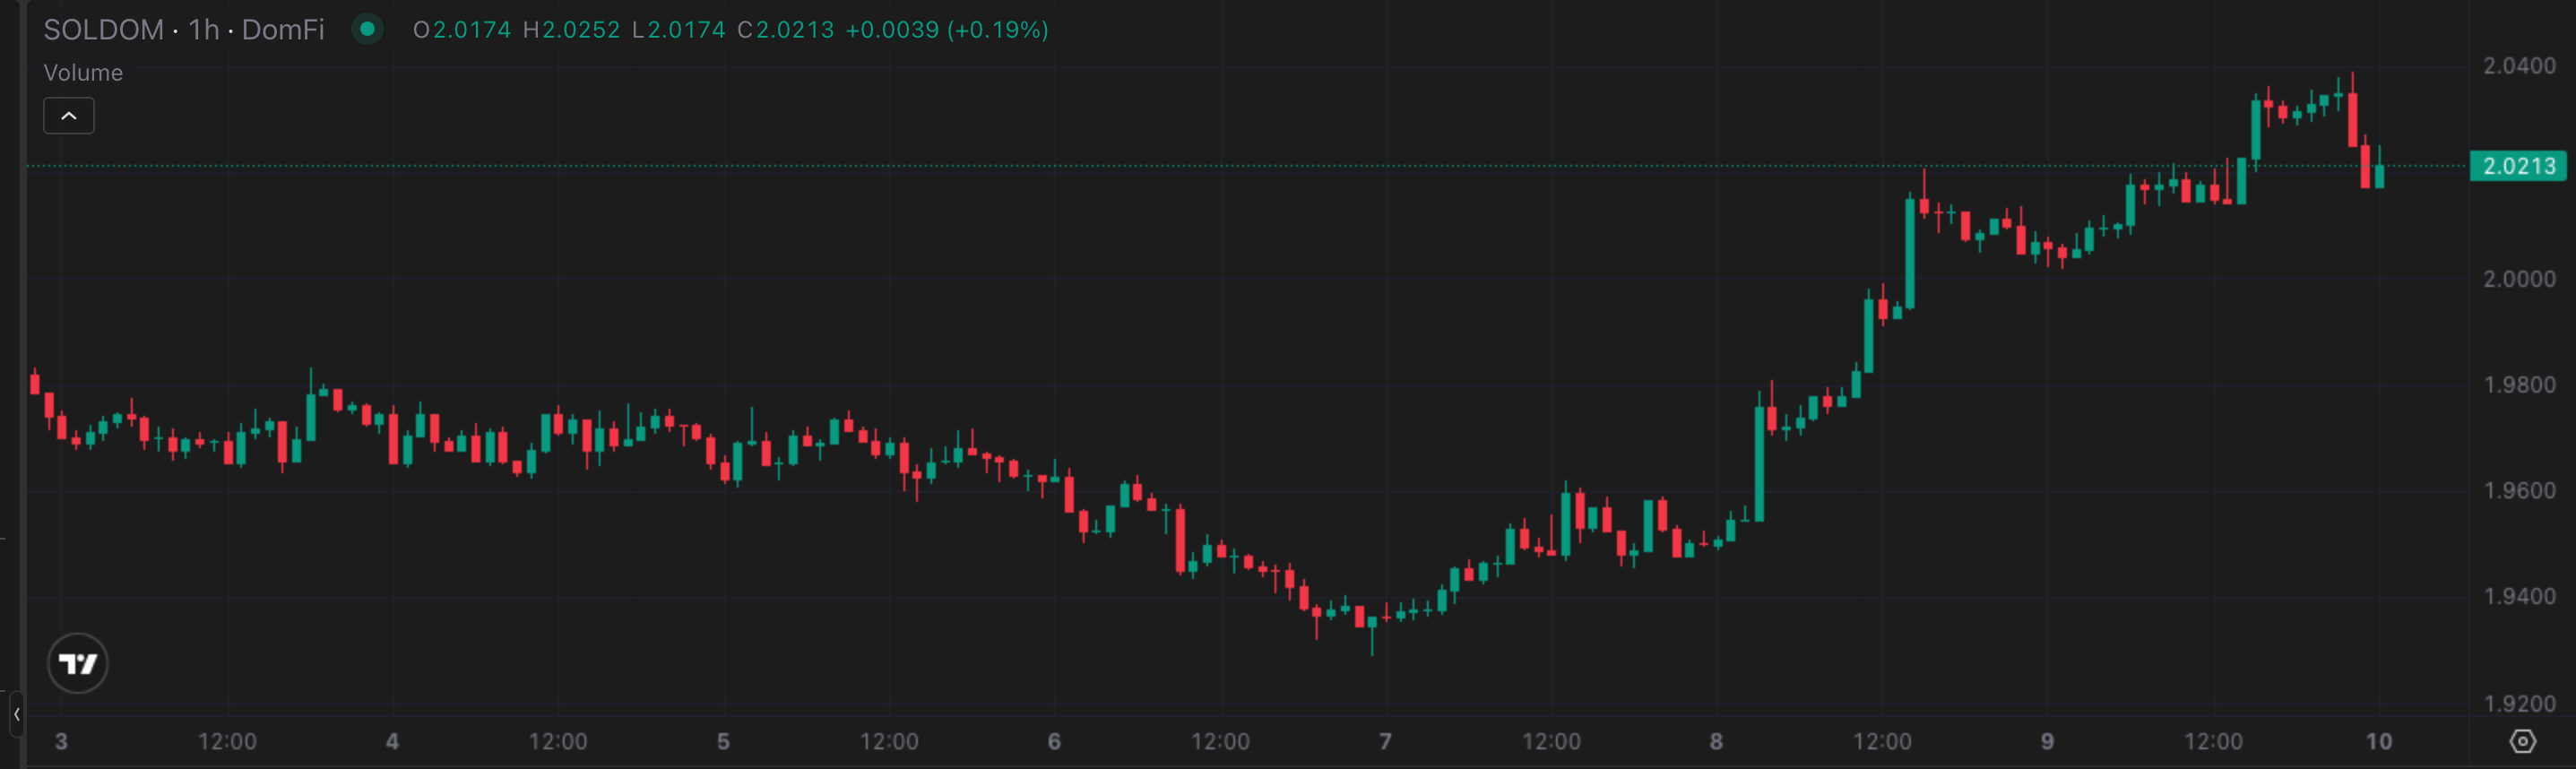
Solana Dominance opened the week at 1.97% and spent its first half building a descending structure: lower highs into a trough of 1.93% that printed late Thursday, August 6, into early Friday, August 7. From there the structure inverted cleanly. Saturday and Sunday built a run of higher highs and higher lows, the mirror image of the week’s first half. The 2.00% level, which SOLDOM had traded beneath for most of the week, was reclaimed during Saturday, August 8, and held for the remainder of the week; SOLDOM traded above it into the close. The intraweek high of 2.04% printed Sunday, August 9, at 22:00 UTC, the final hours of the week.
This Week’s Price Action
SOL’s price rose 3.78% on the week, from $73.44 to $76.21, well ahead of the 1.59% pace the total market set. That gap is the entire dominance move: SOL’s market cap grew faster than the market around it, and the surplus showed up directly as SOLDOM expansion. The close at 2.02% is not a rounding of the open; it is the product of price outrunning the pace of the whole complex by a wide margin.
The Daily View
The daily 00:00 UTC readings tell the story precisely: 1.974% Monday, 1.974% Tuesday, 1.966% Wednesday, 1.962% Thursday, 1.936% Friday, 1.950% Saturday, 2.007% Sunday, closing at 2.02%. Read that sequence in order and the shape is unmistakable: four straight days of decline into Friday’s low, then a two-day reversal that accounts for the entire weekly gain. This was not a week-long grind higher. Solana Dominance was down on the week as late as Friday morning and made every point of its 2.54% gain in the roughly 60 hours that followed.
The Why
The sharpest detail of the week is that Solana Dominance posted the board’s largest gain while Solana’s own spot ETFs posted a net outflow of $859.45K on August 6, the same day BTC ETFs took in $128.69M and ETH ETFs took in $92.15M. The bid behind SOLDOM’s reversal did not come through the institutional ETF wrapper. It came from spot and on-chain accumulation running alongside a supply-side tokenomics repricing, and both were significant factors in their own right.
On the accumulation side, an on-chain TWAP program working toward 500,000 SOL had already bought roughly 186,000 SOL, about $14.16M, by week’s end. Network usage backed that bid: Solana carried over 1.01 billion transactions in the week ending August 2 and accounted for 19% of a record $759M in July crypto card volume. On the tokenomics side, two validator proposals, SIMD-0553 and SIMD-0550, moved through their signaling window. SIMD-0553 would introduce resource-based transaction fees that raise daily SOL burns from roughly 650 coins to as many as 9,000; SIMD-0550 would double the annual disinflation rate, pulling Solana’s 1.5% terminal inflation forward from 2032 to 2029. Validator support stood at 63 million SOL, 14.4% of staked supply, against the 65.16 million SOL, or 15%, needed to trigger a formal stake-weighted vote, with the signaling window closing August 18. None of this alone explains a 2.54% dominance swing; taken together, on-chain accumulation, network usage, and a live supply-tightening proposal amplified a price move that was already outrunning the market.
The Outlook
Two genuine catalysts sit just past the coming week, and both point in the same direction. The SIMD signaling window closes August 18, with validator support at 14.4% of staked supply still short of the 15% threshold needed to force a formal vote; and the Agave 4.2 client, which carries the SIMD-0525 block-time cut toward 200ms, is scheduled to activate on mainnet the week of August 17. If signaling clears 15% or Agave 4.2 activates on schedule, both reinforce the accumulation and supply-tightening story already visible on-chain, and SOLDOM should build on its reclaim of 2.00% rather than retest it. If signaling stalls short of the threshold and the ETF outflow pattern persists, 2.00% is the level that gives the reversal back. Position around 2.00% holding as support into the next two weeks.
Trade SOLDOM: https://app.domination.finance/SOLDOM
4. THE DOMINANCE MATRIX
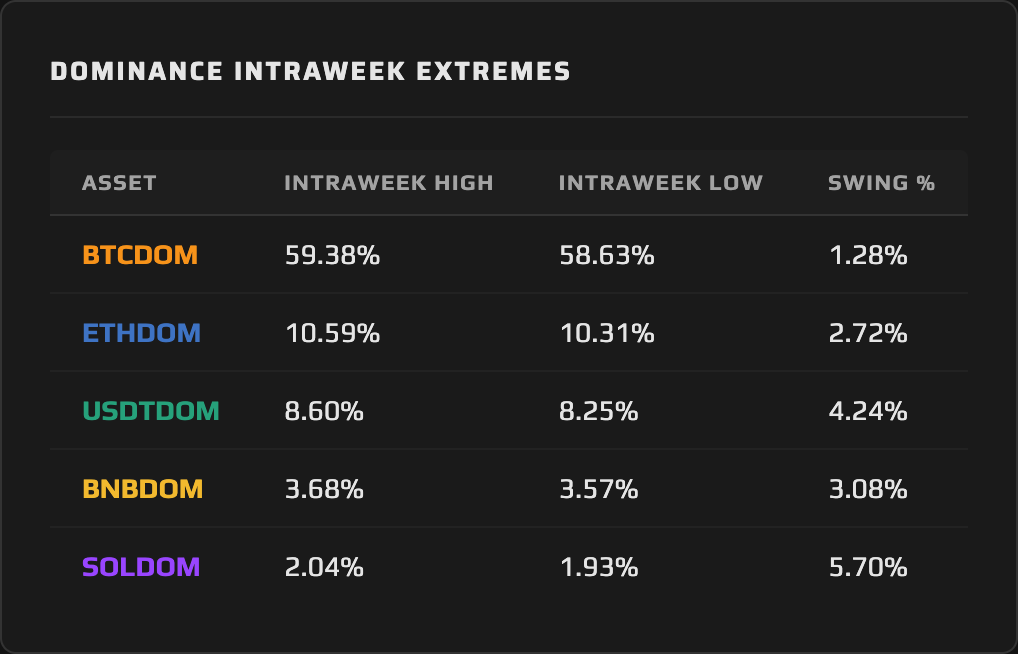
Bitcoin Dominance and BNB Dominance arrived at effectively the same place this week, +0.58% and +0.55%, and got there by opposite routes. BTCDOM peaked at 59.38% on Friday, August 7, and eased into the close at 59.18% as the weekend bid rotated elsewhere. BNBDOM did the reverse: it bottomed at 3.57% that same Friday and rallied to a 3.68% high on Saturday, August 8, before settling at 3.64%. Same destination, opposite paths, and both consistent with a market where the marginal bid moved around during the week rather than sitting still.
Ethereum Dominance is the pair that rose in price and still lost market share. ETH gained 1.42% on the week, a real advance, and ETHDOM still slipped 0.10%, from 10.49% to 10.48%, because the total market grew 1.59%, faster than ETH did. Price and dominance are not the same measurement, and this week is the cleanest illustration of the gap between them on the board.
Tether Dominance was the largest decliner and the cleanest read on the week’s character. USDTDOM fell 1.65%, from 8.46% to 8.32%, but aggregate stablecoin supply did not shrink to produce that decline: it grew 0.25%, from $305.26B to $306.01B, over the same week. Dollars did not leave stablecoins. Tether Dominance fell because the market around that cash pile expanded roughly six times faster than the pile itself did, share compression through market growth rather than redemption. USDTDOM’s low printed at 22:00 UTC on Sunday, August 9, the final hours of the week, meaning the risk bid was still building as the week closed rather than fading into it.
The swing figures add a layer the closes alone miss. USDTDOM’s 4.24% intraweek swing and SOLDOM’s 5.70% were the widest on the board, both consistent with pairs that moved sharply within the week even where the close-to-close number tells a calmer story. BTCDOM’s 1.28% swing was the tightest, the mark of a pair that drifted rather than whipsawed even as it gave back ground into the weekend.
Synthesis: This was a broad risk-on expansion in which the cash pile lost share to nearly everything around it, and the marginal bid rotated outward across the majors in the back half of the week rather than concentrating in any single one.
5. THE WEEK AHEAD — EVENTS CALENDAR
Monday, August 10 — RAIN cliff unlock: $471.6M (3.23% of supply).
Tuesday, August 11 — NRS token unlock: $151.5M | Pi Network Protocol 26 mainnet node software cutoff.
Wednesday, August 12 — US CPI, July (Consensus: 3.4% | Prior: 3.5%).
Thursday, August 13 — US PPI, July.
What to Watch for Dominance: Wednesday’s CPI print is the one release capable of repricing the entire complex at once, which is the only path a macro number has into the dominance picture. A soft read extends the pattern that closed this week, Tether Dominance lower and the risk pairs higher, and keeps SOLDOM’s 2.00% level supported. A hot print sends capital back into the cash pile and lifts USDTDOM off its 8.25% low. The RAIN and NRS unlocks Monday and Tuesday are the crypto-native tests in between, worth watching for whether supply pressure on those tokens spills into the broader dominance charts or stays isolated.
6. CLOSING REMARK
The dominance charts this week describe a market that expanded and rewarded whoever outran it. SOLDOM’s 2.54% gain looks, at the close, like a steady week higher. It was not: Solana Dominance spent four days losing ground and made the entire move in the final 60 hours, driven in large part by on-chain accumulation and a live supply-tightening proposal rather than the institutional ETF flow that carried BTC and ETH. That the marginal buyer showed up on-chain while the ETF wrapper posted a net outflow is the detail worth carrying into next week.
The remaining pairs told a consistent story underneath it. BTCDOM and BNBDOM reached nearly identical gains by opposite paths, ETHDOM lost share on a week ETH’s price rose, and USDTDOM gave up the most ground of all, not because stablecoin supply shrank but because the market around it grew six times faster. When the cash pile loses share broadly while every other pair finds its own route higher, the signal is a market getting comfortable with risk, not fleeing from it. Whether that comfort survives Wednesday’s CPI print is the question the next issue answers.
- Trade on DomFi: https://app.domination.finance/
- Deposit USDC into the Vault: https://app.domination.finance/vault
- Make a Referral Code: https://app.domination.finance/referrals
- Join our Discord: https://discord.com/invite/6wG5cdNSbM
This content is produced by domination.finance for informational and educational purposes only. Nothing contained herein constitutes financial or investment advice. Always conduct your own research.