Dominance Debrief #20
BTCDOM fell alongside ETHDOM and SOLDOM this week; the safe-haven bid skipped it entirely. USDTDOM and BNBDOM were the only two pairs to gain, with BNBDOM leading the board at +4.93%.
THE DOMINANCE DEBRIEF
Week of July 27 – August 2, 2026
Issue #20
BTCDOM fell alongside ETHDOM and SOLDOM this week; the safe-haven bid skipped it entirely. USDTDOM and BNBDOM were the only two pairs to gain, with BNBDOM leading the board at +4.93%.
1. THE WEEK IN DOMINANCE
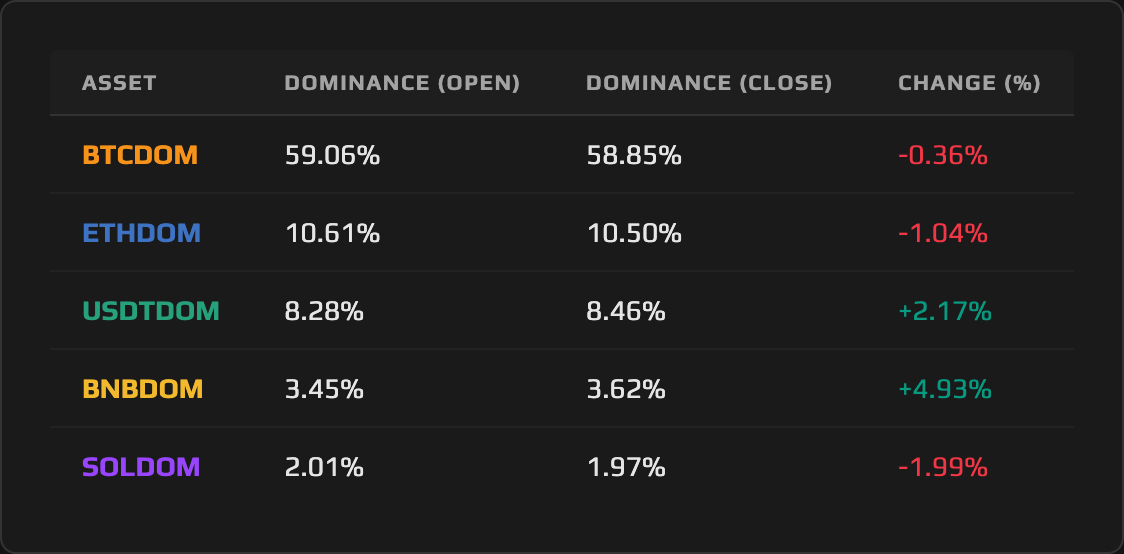
BTCDOM, ETHDOM, and SOLDOM all finished the week lower, and the defensive bid did not land in Bitcoin Dominance. BNBDOM led every gainer at +4.93%, rising from 3.45% to 3.62%, while USDTDOM added 2.17% to close at 8.46%. BTCDOM slipped 0.36% to 58.85%, ETHDOM gave back 1.04% to close at 10.50%, exactly the level it broke out above the prior week, and SOLDOM lost 1.99% to finish at 1.97%. Capital left risk assets for cash and for the chain with the busiest on-chain activity, not for the market’s usual anchor.
2. MACRO CONTEXT — THE BACKDROP
Total crypto market cap fell from roughly $2.21 trillion to roughly $2.15 trillion this week, an estimated decline of about 2.5%. The Fear & Greed Index slid from 30 (Fear) to 27 (Fear), touching a low of 25 (Extreme Fear) on Friday, July 31. The Federal Reserve held its policy rate at 3.50–3.75% at its July 29 meeting, with three officials dissenting in favor of a hike.
Friday carried the week’s real stress. BTC fell from above $65,000 to roughly $62,236 intraday on specific triggers, not one macro cause: Coinbase missed on earnings and its stock fell 10%, Strategy signaled it would keep selling Bitcoin, a Coldcard hardware wallet exploit resulted in at least $38 million in stolen BTC, and capital rotated back into equities as the S&P 500 rebounded the same session. Spot Bitcoin ETFs recorded a net weekly outflow of $61.53 million, with $265.37 million leaving on Friday alone; spot Ethereum ETFs took in $27.42 million net, a fourth consecutive week of inflows.
The result touched nearly every risk asset at once, not a rotation between them. BTC still finished the calendar month of July up roughly 7% despite the Friday flush, a reminder the drawdown sat inside a longer uptrend rather than reversing it: a broad, shallow risk-off week, not a capitulation.
3. ASSET DEEP DIVE
BNB (BNBDOM) Dominance
Open Price: 3.45% / Close Price: 3.62% / WoW Change: +4.93%
The Structure
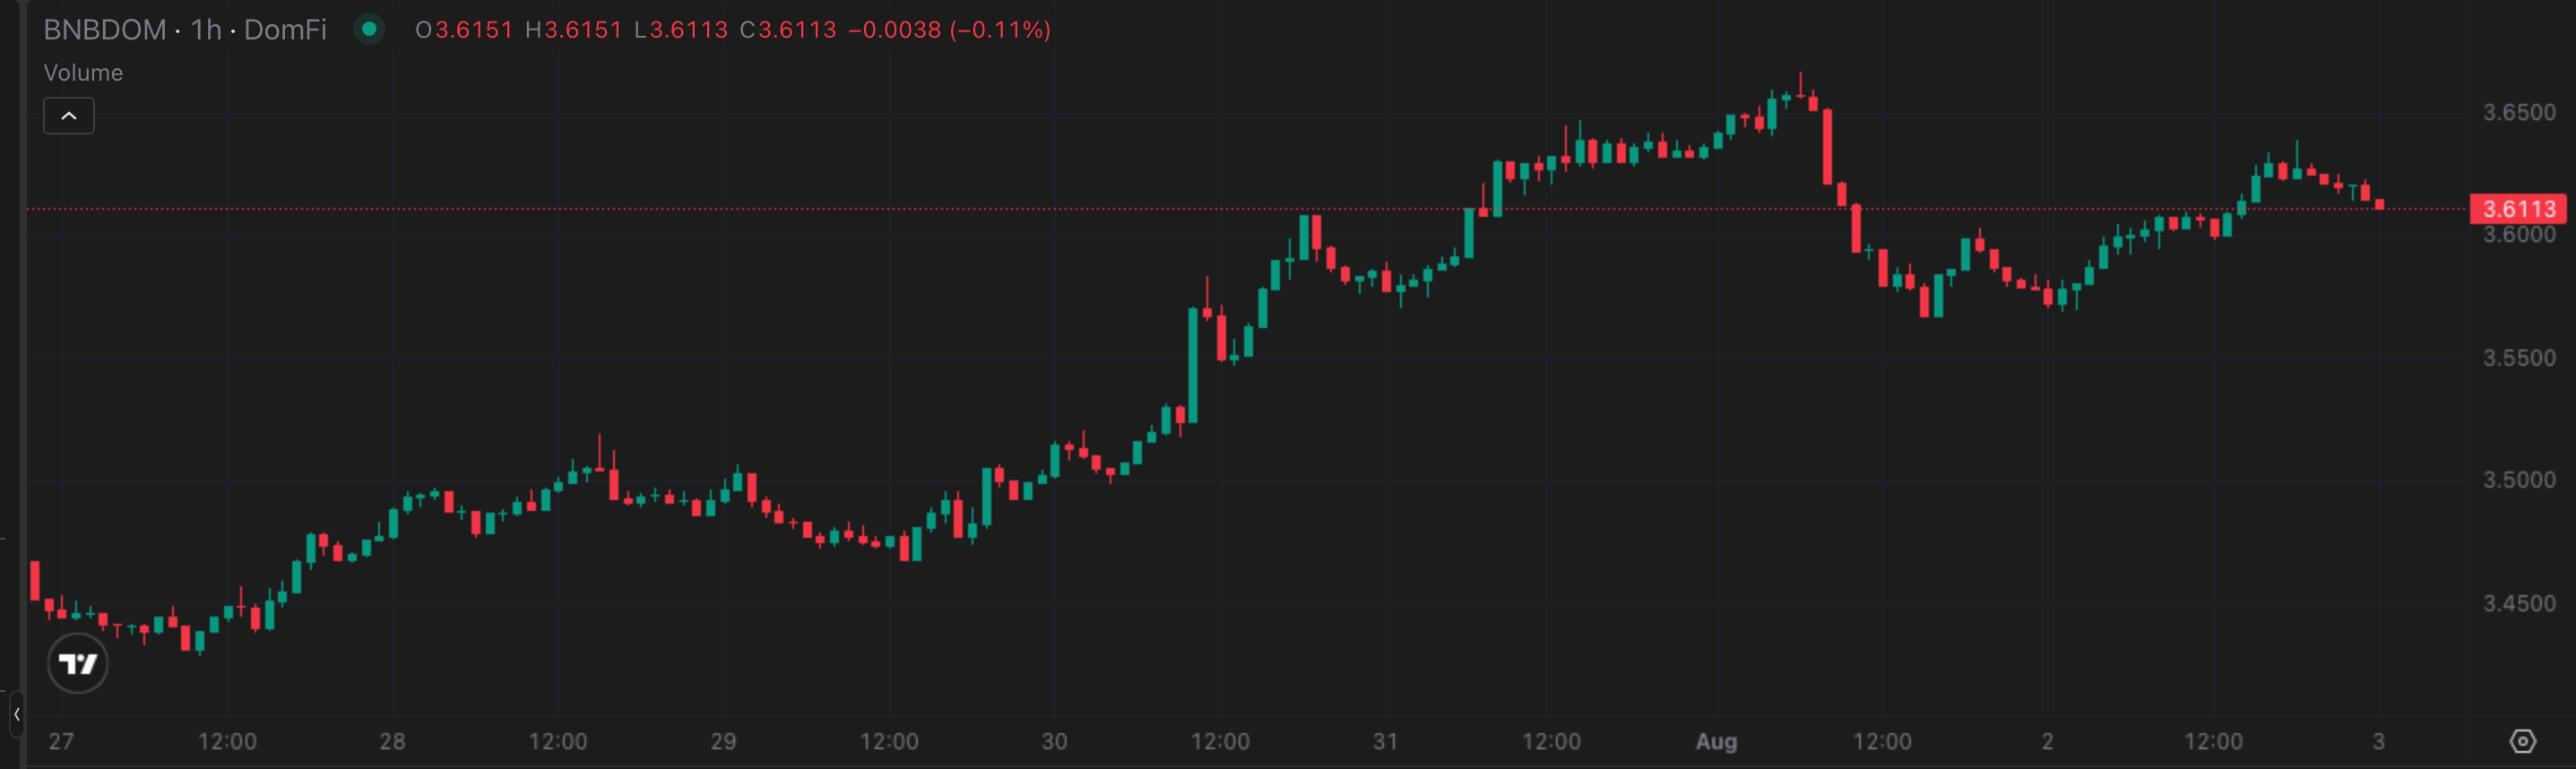
BNBDOM spent June and July in a sustained contraction, falling from a 3.99% intraday print on June 1 to a low of 3.38% on July 22, the low of the June–July contraction. That low is where the current structure begins. Higher lows have built in five consecutive readings since: 3.38% (Jul 22), 3.41% (Jul 24), 3.43% (Jul 27, this week’s open), 3.50% (Jul 30), and 3.57% (Jul 31). BNB Dominance traded above 3.60% on July 30 for the first time since July 12, Saturday’s 3.67% intraweek print is the highest since July 5, and the 3.62% weekly close is BNBDOM’s highest weekly close since the week ending July 5.
This Week’s Price Action
BNBDOM gained 4.93% this week, the largest move and the largest swing on the board at 7.00%, and the mechanism behind it worked from both directions at once. BNB’s price rose 2.25%, to $587.59 from $574.67, the only gainer among the underlying assets covered here. At the same time, the total crypto market contracted an estimated 2.5%. BNB’s market cap grew while the market it is measured against shrank, and BNBDOM captured both halves: a genuine gain in market share, compounded by a market contracting around it.
The Daily View
The daily closes show a steady build, not a spike. BNBDOM rose in five of seven sessions: +0.80% Monday, +0.41% Tuesday, +0.29% Wednesday, +2.39% Thursday, and +1.42% Friday, the two biggest days landing back to back and carrying the bulk of the gain. Saturday was the only down day, -1.60%, before Sunday recovered +1.04% into the close. The intraweek high of 3.67% printed at 06:00 UTC Saturday; the intraweek low of 3.43% printed early Monday at 10:00 UTC, and the week never revisited it. Set against last week’s ETHDOM move, which delivered nearly its whole gain in one thin-liquidity Sunday session, this was the opposite: a gain built session by session, Thursday and Friday doing the heavy lifting rather than a single squeeze.
The Why
The chain behind the move: BNB Chain led every Layer-1 network in weekly decentralized exchange volume, processing $19 billion against Solana’s $10.6 billion and Ethereum’s $5.8 billion, with PancakeSwap the main driver, fueled by retail activity and another wave of memecoin speculation. That volume is a real, on-chain signal of activity concentrating on one network in a week when capital broadly retreated from risk, and it is a significant factor behind BNB’s price holding up while every other major asset covered here fell.
The price chart backs up the on-chain read. BNB broke a 45-day descending trendline this week connecting lower highs since roughly $632 in mid-June, rallying more than 5% before sellers stepped in near $600 and the advance stalled around $590 by July 31. It has not closed above $600; prior attempts stalled near $598 on June 22 and $594 in early July. BNB Chain’s 36th quarterly burn, which destroyed 1,615,827.795 BNB (roughly $932 million) in mid-July, is background context rather than this week’s trigger; the DEX volume surge is the more immediate driver.
The Outlook
The honest read is conditional. BNB still has not closed above $600, and a meaningful share of this week’s BNBDOM advance came from the market shrinking around it, not from BNB’s own strength alone; if the broader market stabilizes or rallies next week, that half of the mechanism reverses. The bull case needs two confirmations: BNB clearing and holding above $600, and BNBDOM defending the 3.60% level it reclaimed on Friday’s close. Hold both, and two things happen at once: the higher-low sequence extends further, and 3.60% holds as support rather than reverting to resistance. Lose 3.60% on a daily close, and this week’s gain reads as a byproduct of a shrinking market, not a durable expansion.
4. THE DOMINANCE MATRIX
The Absent Flight to Quality: BTCDOM
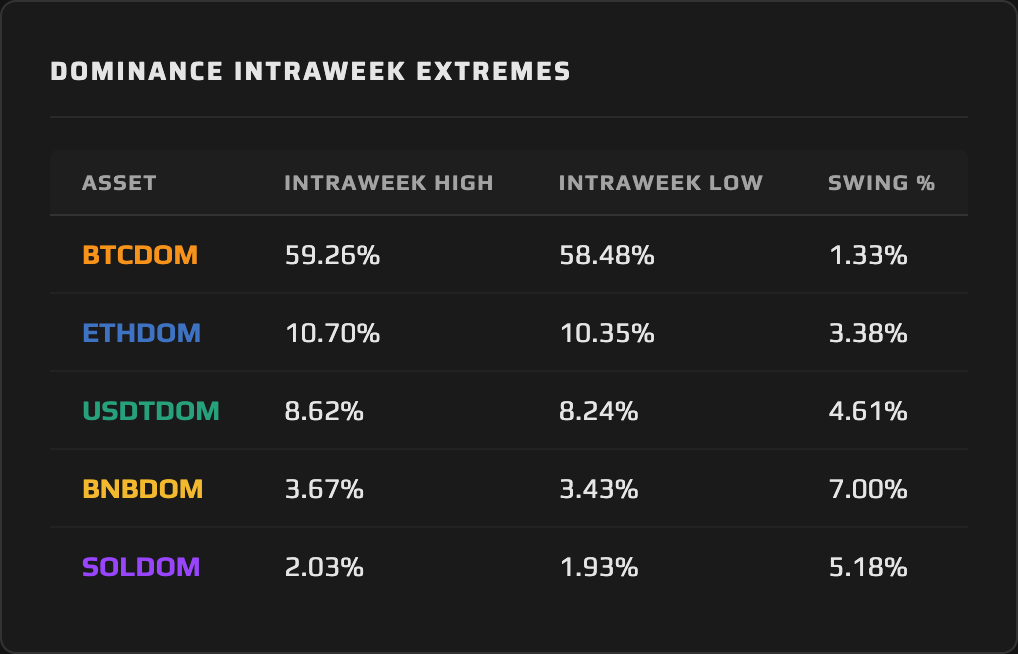
Bitcoin Dominance fell 0.36%, from 59.06% to 58.85%, in a week the total market contracted an estimated 2.5%. That is the header story for BTCDOM: in a drawdown, the safe-haven bid did not go to Bitcoin Dominance. BTC’s price fell 2.84%, slightly faster than the market’s own estimated pace, and BTCDOM fell with it instead of gaining ground defensively. The $61.53 million net weekly outflow from spot Bitcoin ETFs, including $265.37 million on Friday alone, is a significant factor: capital left Bitcoin exposure during the week’s worst session rather than concentrating there. BTCDOM printed its high of 59.26% on Wednesday, flushed to its low of 58.48% at 14:00 UTC Friday alongside the broader risk-off session, and recovered into the close.
The Cash Bid: USDTDOM
Tether Dominance rose 2.17%, the only other pair to gain, closing at 8.46% from an 8.28% open, which reads like fresh capital piling into stablecoins but is largely the opposite. The aggregate stablecoin market cap, the whole category rather than Tether specifically, shrank 0.80% this week, from $306.17 billion to $303.72 billion. USDTDOM’s gain came from the category falling slower than the total market fell around it, not from inflow: dilution in reverse rather than a defensive bid arriving, and the +2.17% measures Tether’s share of the total crypto market, not its share inside the stablecoin category. Tether’s own circulation kept shrinking through the same window, down roughly $5.4 billion over sixty days to around $184 billion. The more interesting signal is supply versus turnover: Tether holds the larger float against USDC’s roughly $73.5 billion, yet USDC captured a record 12.5% of crypto trading volume in the second quarter of 2026. That divergence is a dominance story within the dominance story, depth the dominance lens surfaces, not a gap in it.
The Give-Back: ETHDOM
Ethereum Dominance fell 1.04%, from 10.61% to 10.50%, and the path there matters more than the number. ETHDOM printed its intraweek high of 10.70%, the highest ETHDOM has traded in the last eight weeks, at 13:00 UTC Monday, the very first session, then declined on five of the seven days. It lost the 10.50% level on daily closes of 10.46% Friday and 10.40% Saturday, traded down to an intraweek low of 10.35% at 18:00 UTC Saturday, and clawed back Sunday to finish precisely at 10.50%. The level was lost intraweek and the week closed back at it; it did not hold, it was recovered. Last week’s Sunday squeeze, which carried ETHDOM above 10.50% on thin weekend liquidity, borrowed against this week rather than confirming a breakout.
SOLDOM and the Competitive Read
Solana Dominance fell 1.99%, from 2.01% to 1.97%, on the worst price performance of the week: SOL fell 4.13%, more than any other asset covered here. SOLDOM also carried the widest intraweek swing outside of BNBDOM, at 5.18%, with its low of 1.93% landing at 18:00 UTC Saturday. Solana’s $10.6 billion in weekly DEX volume trailed BNB Chain’s $19 billion by a wide margin, the same week that activity lead carried BNBDOM to the top of the board while SOLDOM sat near the bottom.
ETHDOM’s low, SOLDOM’s low, and USDTDOM’s high of 8.62% all printed in the same hour, 18:00 UTC on Saturday, August 1, a single risk-off moment visible across three separate pairs at once.
The full dominance picture this week describes a risk-off regime where the safe-haven bid bypassed Bitcoin Dominance entirely and went to cash, while the only asset-side gain in market share went to the chain with the most on-chain activity.
5. THE WEEK AHEAD — EVENTS CALENDAR
Wednesday, August 5 — Ethena (ENA) token unlock: 172 million ENA, $95.8 million, 2.70% of circulating supply | Circle (CRCL) Q2 2026 earnings, 8:00 ET
Thursday, August 6 — MultiversX mainnet upgrade v1.11.10.0 activation epoch
Friday, August 7 — July nonfarm payrolls (Consensus: 117,500 | Prior: 57,000) | Final scheduled Senate workday before the August recess, with no floor vote scheduled for the CLARITY Act
Sunday, August 9 — Cardano CME futures reach six months, opening eligibility for the SEC’s 75-day generic listing standards review for a spot ADA ETF
What to Watch for Dominance: Whether BNB clears and holds above $600, and whether BNBDOM defends the 3.60% level it reclaimed on Friday’s close, will determine whether this week’s gain extends or reverts to range. USDTDOM’s 8.46% close is most exposed to a shift in tone; this week’s gain came from the stablecoin category shrinking slower than the market, not from inflow, so any genuine return of risk appetite is the fastest way to see 8.46% given back. Circle’s Wednesday earnings read directly on the stablecoin complex behind USDTDOM, a look at whether USDC’s record 12.5% trading-volume share carried into the third quarter.
6. CLOSING REMARK
The dominance charts this week draw a clean distinction between two kinds of gain. USDTDOM’s 2.17% rise came from the stablecoin category falling slower than the market around it, a defensive position built by standing still while everything else moved faster. BNBDOM’s 4.93% rise came from something else: BNB’s price actually grew while the market shrank, a genuine gain in market share stacked on the same compression that lifted USDTDOM. Both benefited from the same contracting backdrop; only one also earned its gain on its own terms.
That is the real lesson: Bitcoin Dominance, the market’s usual anchor, was not where the defensive capital landed. BNBDOM and USDTDOM both carry a condition into next week: BNBDOM needs BNB to clear $600 and hold above 3.60% on its own strength, and USDTDOM needs the broader market to stay soft, because renewed risk appetite reverses the mechanism behind both gainers.
This content is produced by domination.finance for informational and educational purposes only. Nothing contained herein constitutes financial or investment advice. Always conduct your own research.