Dominance Debrief #19
ETHDOM surged +3.41%, absorbing almost the entire market's growth. BTCDOM matched the market's own pace exactly, +0.03%. BNBDOM and SOLDOM lost share despite rising prices, and USDTDOM fell -1.19% on a nearly flat stablecoin base.
THE DOMINANCE DEBRIEF
Week of July 20 – July 26, 2026
Issue #19
ETHDOM surged +3.41%, absorbing almost the entire market’s growth. BTCDOM matched the market’s own pace exactly, +0.03%. BNBDOM and SOLDOM lost share despite rising prices, and USDTDOM fell -1.19% on a nearly flat stablecoin base.
1. THE WEEK IN DOMINANCE
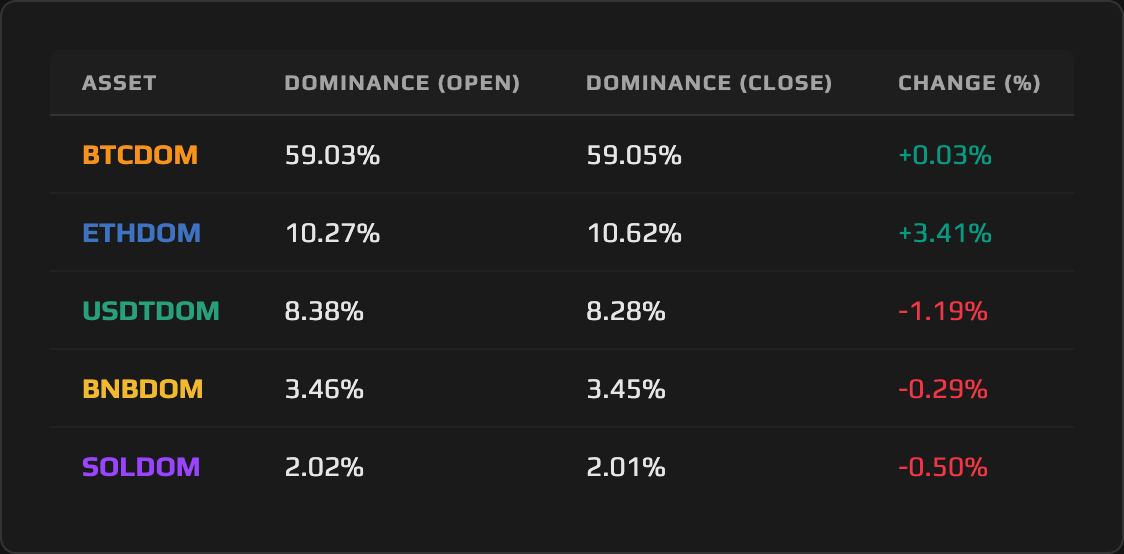
Ethereum Dominance did essentially all of the market’s work this week, rising 3.41% while Bitcoin Dominance simply matched the total market’s own growth and held flat at +0.03%. BNBDOM, SOLDOM, and USDTDOM all finished lower, each for a different reason: two priced higher and still lost ground, one saw its whole category barely move at all. The market grew about 1.0% this week. Ethereum Dominance kept nearly all of it.
2. MACRO CONTEXT — THE BACKDROP
The total crypto market cap grew from roughly $2.18 trillion to roughly $2.20 trillion this week, an estimated gain of about 1.0%. The Fear & Greed Index moved out of Fear and into Neutral territory, climbing from the mid-40s to the low-50s against a reading of roughly 30 the prior week. Initial jobless claims for the week ending July 18 came in at 187,000, the lowest reading in nearly 60 years.
That 1.0% growth did not spread evenly. One dominance pair captured nearly all of it; the rest of the complex matched the market’s own pace or fell behind it, each for its own distinct reason. That unevenness, not the growth figure itself, is what this issue is about.
3. ASSET DEEP DIVE
Ethereum (ETH) Dominance
Open Price: 10.27% / Close Price: 10.62% / WoW Change: +3.41%
The Structure
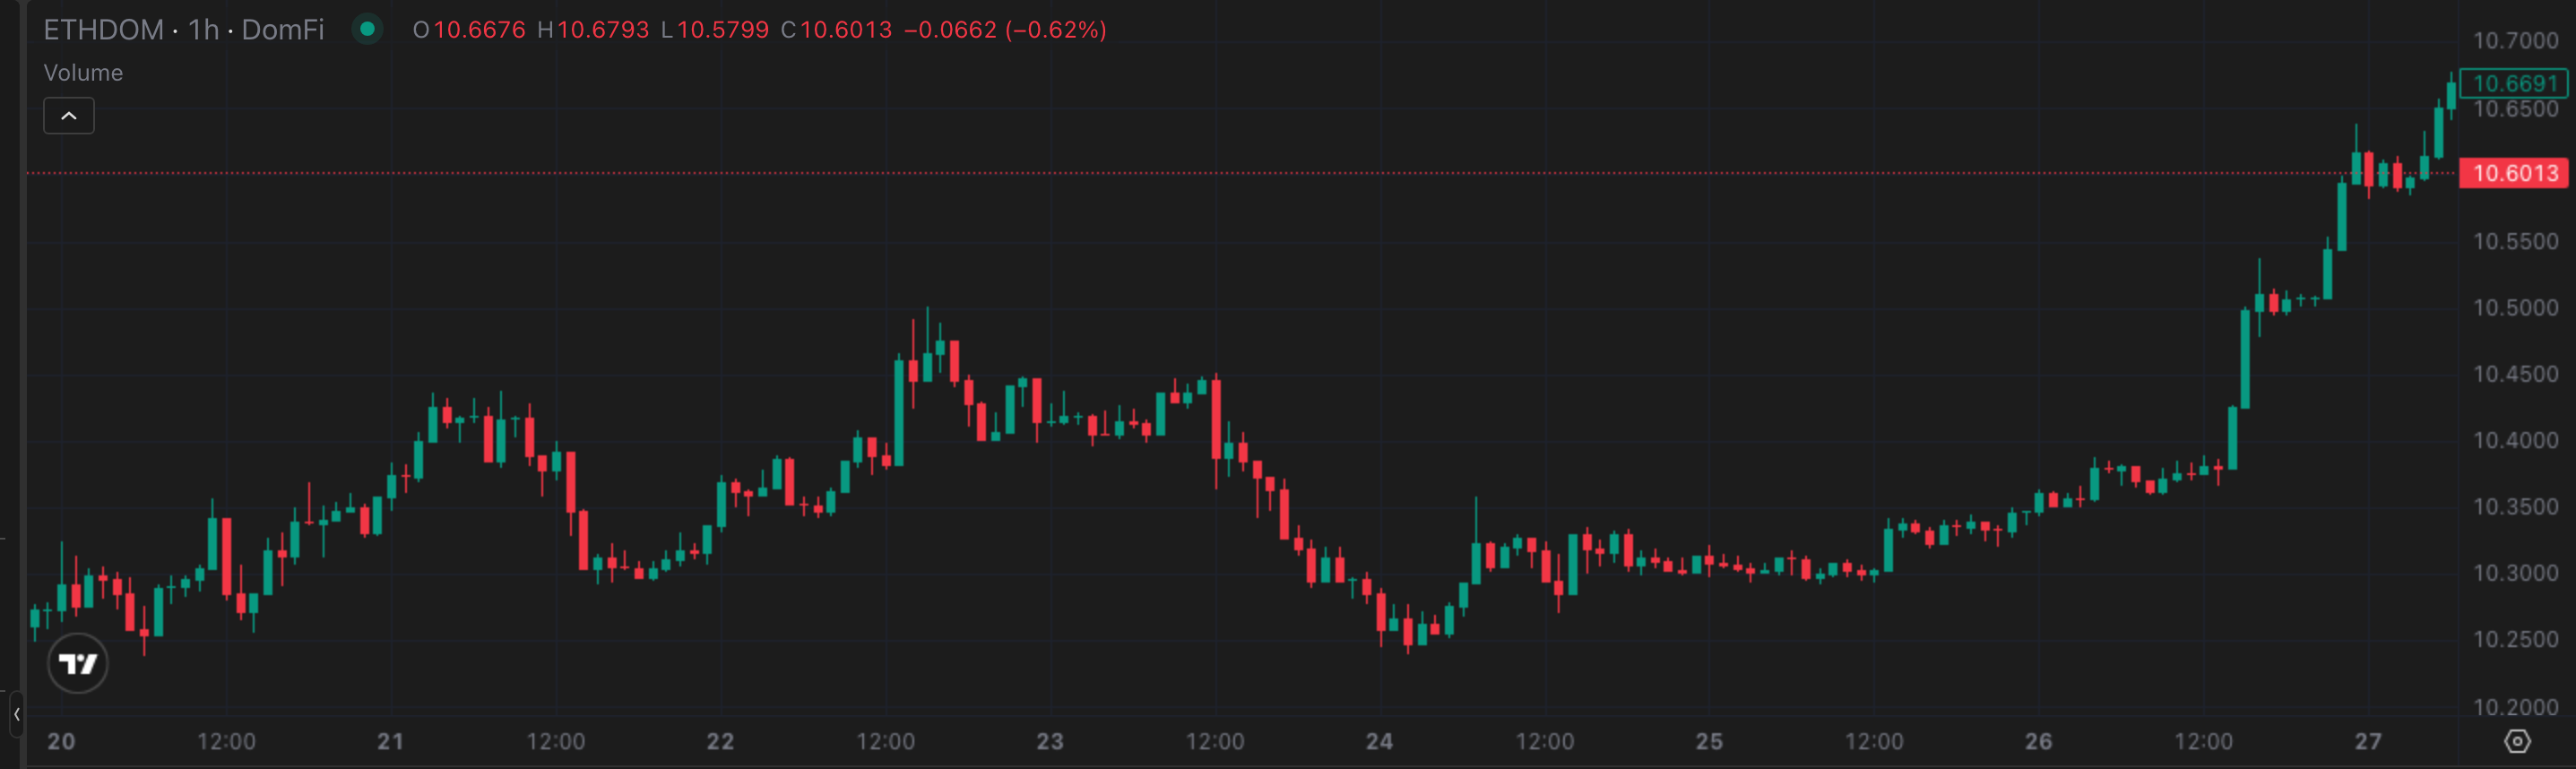
Ethereum Dominance opened the week at 10.27% and immediately gave ground, tagging the week’s intraweek low of 10.24% in the opening hours of Monday morning. From there it spent six days compressing into a tight band, ranging roughly between 10.25% and 10.50% and repeatedly testing the 10.50% level without ever sustaining a move above it. That level held as resistance from Monday through Saturday, a six-day coil with no net progress to show for it. Sunday broke the structure entirely: ETHDOM ran to the week’s intraweek high of 10.64% and closed at 10.62%, above the prior week’s high of 10.51%. The 10.50% level, which resisted six days of attempts, now sits below the close as support rather than resistance.
This Week’s Price Action
The weekly candle tells a story of a long coil resolving in a single session. ETHDOM opened, dipped, and then spent six days going almost nowhere before a vertical Sunday move carried it to the 3.41% weekly gain. ETH’s price rose 4.38% this week to a two-month high near $1,952, more than four times the total market’s own 1.0% growth, and that gap between ETH’s price gain and the market’s pace is the real source of ETHDOM’s expansion: a genuine gain in market share, not just a ride on the market’s own tide.
The Daily View
Monday carried ETHDOM down to its 10.24% low before the range-bound stretch began. The pair closed Friday, July 24 at 10.31% and Saturday, July 25 at 10.35%, meaning ETHDOM carried a 0.39% gain into the final day of the week. Sunday, July 26 broke the pattern completely: ETHDOM ran to the intraweek high of 10.64% at 23:00 UTC before settling at the 10.62% close. Close to four-fifths of the entire weekly gain landed in that single Sunday session, in thin weekend liquidity.
The Why
Two separate mechanisms built the fuel for this move, and a third lit the match. Spot Ethereum ETFs took in $103.9 million net over July 20 to 24, against $33.79 million for spot Bitcoin ETFs, roughly three to one in Ethereum’s favor and $137.69 million combined; it marked the third consecutive week of net inflows for both. Separately, July 23 brought the SEC’s settlement of the long-running FOIA lawsuit over its Ethereum investigation records, paying $150,000 in fees and producing the remaining documents. The case, brought by History Associates on behalf of Coinbase and filed in June 2024, concerned Ethereum’s shift to proof-of-stake, and its resolution removed a roughly two-year regulatory overhang that had sat over the asset the entire time.
Neither of those was the proximate trigger for Sunday’s vertical move. That trigger was mechanical: a cluster of short liquidations in the ETH perpetual swap market forced a rapid price spike in thin weekend conditions, and that squeeze is what turned a six-day coil into a breakout in a matter of hours. The ETF flows and the cleared legal overhang were the accumulated fuel; the Sunday liquidation cluster was the spark. They are causally distinct, and collapsing them into one story would miss that the durable catalysts and the mechanical trigger did different jobs this week.
The Outlook
The honest read here is conditional, not triumphant. The structural pieces, the ETF inflow streak and the cleared FOIA overhang, are durable and do not expire with the weekend. The proximate trigger is not: a short squeeze concentrated in a single thin-liquidity session is a fragile foundation for a breakout, and Sunday’s volume conditions are not Monday’s. The real test is whether ETHDOM holds above the 10.50% level, now flipped to support, once weekday liquidity returns and the market gets a chance to either confirm the move or unwind it. If the 10.50% support holds through Monday and into midweek, the coil-and-release resolves into genuine trend continuation. If it doesn’t, this becomes a squeeze that borrowed against next week’s dominance rather than one that earned it.
4. THE DOMINANCE MATRIX
The Lockstep: BTCDOM
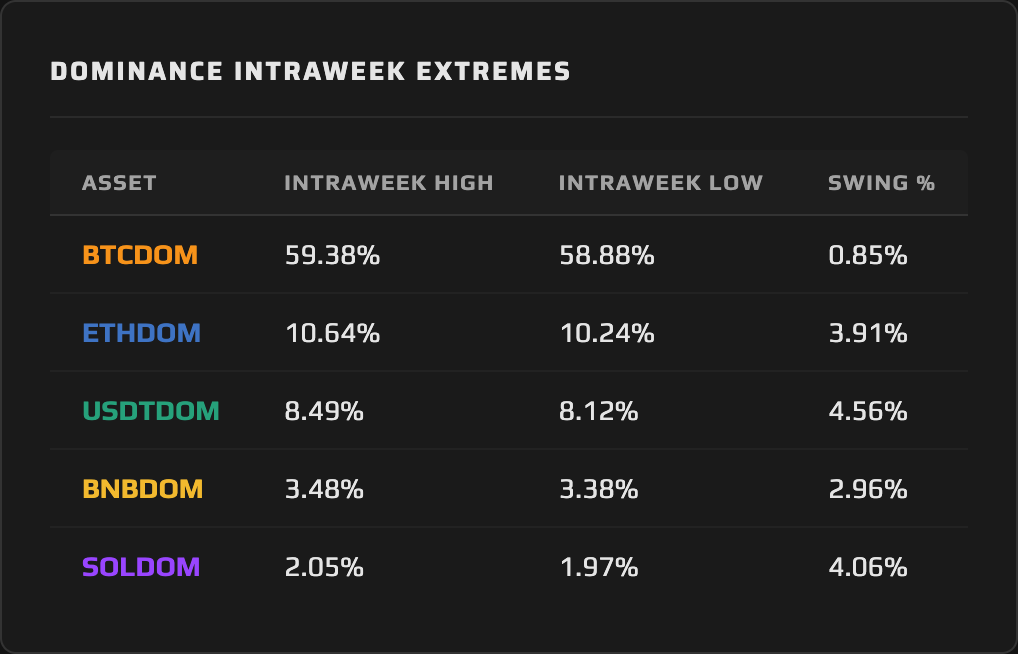
Bitcoin Dominance closed the week almost exactly where it opened, 59.03% to 59.05%, a gain of 0.03%. BTC’s price rose 1.00% against a market that grew roughly 1.0%, and that near-identical pairing is the entire explanation. BTCDOM held its share by moving at the market’s own pace, no faster and no slower. The intraweek swing of 0.85%, the smallest reading on the board, confirms the same picture from a different angle: there was no gap between BTC’s pace and the market’s pace for BTCDOM to close, so it barely had to move at all.
The Double Inversion: BNBDOM and SOLDOM
BNB Dominance fell 0.29%, from 3.46% to 3.45%, and Solana Dominance fell 0.50%, from 2.02% to 2.01%. Both losses arrived with prices moving in the opposite direction of the dominance outcome: BNB’s price rose 0.72% and SOL’s price rose 0.36% this week. Neither asset declined in dollar terms. Both lost market share anyway, because both grew slower than the market grew around them. BNB’s market cap expanded, but not as fast as the total market expanded, and that gap alone was enough to squeeze BNBDOM even as the price rose. The same mechanic applied to Solana Dominance: SOL priced higher and still finished the week smaller as a share of the total.
That is a full inversion of what happened to these same two pairs the prior week, when BNBDOM and SOLDOM lost dominance because their prices outright declined while the market held up around them. The direction is identical, down in both weeks, but the mechanism flipped: last week was price weakness; this week the market simply outran two assets that were still gaining in absolute terms.
The Dominance Story Within the Story: USDTDOM
Tether Dominance fell 1.19%, from 8.38% to 8.28%, the second-largest move on the board after Ethereum Dominance. On its face that reads like capital fleeing stablecoins. It is not. The aggregate stablecoin market cap, the entire category rather than Tether specifically, was nearly flat this week: $306.45 billion to $306.17 billion, a contraction of just 0.09%. USDTDOM’s decline is dilution against a static base, not an outflow. The category held its size; the total market grew around it, and that alone was enough to shrink its share.
That is the inverse of the prior week, when the aggregate stablecoin market cap contracted a full 0.46% on genuine outflow as capital rotated into risk assets. This week, the category did not lose capital; it stood still while everything around it grew. Read without that category context, USDTDOM’s headline number would suggest a repeat of last week’s outflow story. It is closer to the opposite: a dominance story within the dominance story, and the kind of granularity a dedicated stablecoin-basket view would only sharpen further.
Two inversions landing in the same week is itself worth naming as a signal. Across BNBDOM, SOLDOM, and USDTDOM, the reason behind the move changed entirely without the direction changing at all. A reading that stops at the headline percentage would have called this week a repeat. It wasn’t.
The full dominance picture this week describes concentration, not breadth: growth landed almost entirely in Ethereum Dominance, Bitcoin Dominance tracked the market’s own pace exactly, and every other pair lost share despite either rising prices or a category base that barely moved. The market grew about 1.0% this week, and Ethereum kept nearly all of it for itself.
5. THE WEEK AHEAD — EVENTS CALENDAR
Tuesday, July 28 — Zcash Ironwood (NU6.3) upgrade activates, introducing a new shielded pool and strengthened circulating-supply verification
Wednesday, July 29 — FOMC rate decision (Expected: hold at 3.50–3.75%) | Polygon Ithaca hard fork on mainnet | Stacks PoX-5 hard fork enabling self-custodial Bitcoin staking | Hyperliquid (HYPE) token unlock: 2.8% of supply, $817 million | Robinhood Markets (HOOD) earnings, post-market
Thursday, July 30 — Q2 Advance GDP, annualized (Consensus: 2.3% | Prior: 2.1%) | Core PCE Price Index, June year-over-year (Consensus: 2.6% | Prior: 2.6%) | Bank of Japan rate decision (Expected: hold at 1%) | Coinbase Global (COIN) earnings, post-market | Strategy (MSTR) earnings, post-market
Friday, July 31 — Deribit month-end BTC and ETH options expiry | FTX Recovery Trust fifth creditor distribution, approximately $900 million
What to Watch for Dominance: The first test for Ethereum Dominance arrives before any calendar print does: whether the 10.50% level, which resisted ETHDOM for six days before Sunday’s break, holds as support once Monday’s deeper weekday liquidity returns and the thin conditions behind the Sunday spike are gone. Two events later in the week put outsized capital back into circulation at once: Wednesday’s $817 million Hyperliquid token unlock and Friday’s roughly $900 million FTX Recovery Trust distribution. Where that capital lands, whether it stays in the assets it’s paid in, rotates toward BTCDOM or ETHDOM, or parks in USDTDOM, is itself a dominance signal worth tracking against BTCDOM’s 59.05% close and USDTDOM’s 8.28% close.
6. CLOSING REMARK
The dominance charts this week describe a market where growth had an address, and it wasn’t a shared one. Ethereum Dominance rose 3.41% by growing faster than the market grew around it, a genuine gain in market share, not a byproduct of the total market’s own 1.0% expansion. Bitcoin Dominance held its ground by moving at exactly the market’s pace, no more. Everything else lost share, and the reasons why matter more than the fact that they did: BNBDOM and SOLDOM gave up ground with prices rising, not falling, a complete flip from the price-driven losses both pairs posted the week before, and USDTDOM’s decline traced to a stablecoin category that barely shrank at all, dilution against a static base rather than the outright outflow that drove its decline the prior week.
Both of those reversals landing in the same week is the real lesson. Direction alone, dominance up or dominance down, was never the whole story; the mechanism behind the number is. A market that grows about 1.0% and hands nearly all of it to one pair, while the rest either matches its pace or gets diluted by it, is not a market moving in one direction. It is a market where market share, not price, decided who won the week.
This content is produced by domination.finance for informational and educational purposes only. Nothing contained herein constitutes financial or investment advice. Always conduct your own research.