Dominance Debrief #13
USDTDOM cratered -2.90% as capital rotated hard into risk. SOLDOM led the charge at +3.93%, surviving a hot CPI print midweek. BTCDOM reclaimed ground at +1.08%; ETHDOM and BNBDOM lost share despite price gains.
THE DOMINANCE DEBRIEF
Week of June 8 – June 14, 2026
Issue #13
TL;DR: USDTDOM cratered -2.90% as capital rotated hard into risk. SOLDOM led the charge at +3.93%, surviving a hot CPI print midweek. BTCDOM reclaimed ground at +1.08%; ETHDOM and BNBDOM lost share despite price gains.
1. THE WEEK IN DOMINANCE
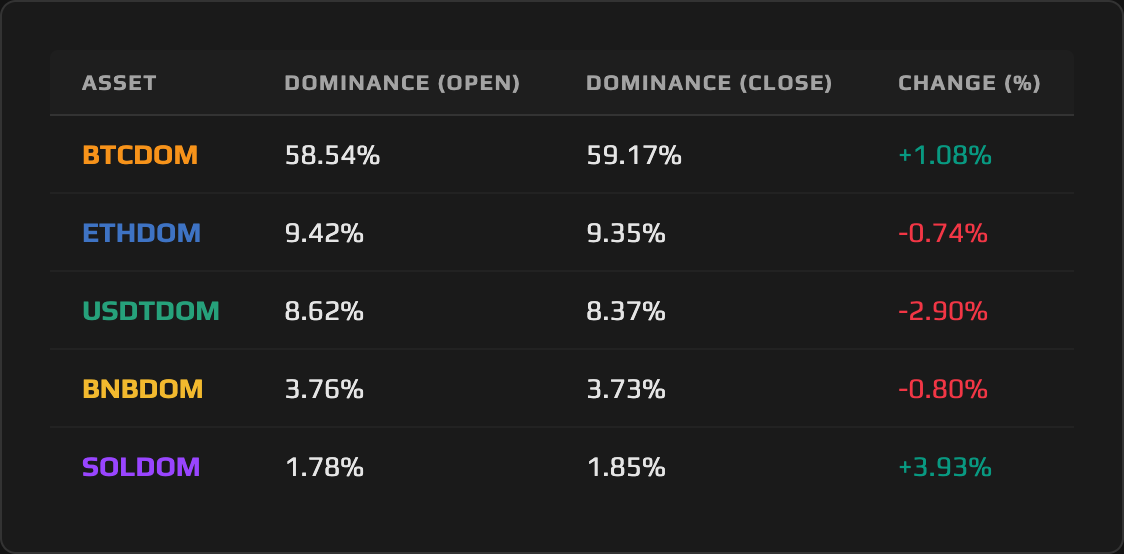
This was a textbook risk-on rotation week: capital poured out of stablecoins and into the highest-beta crypto, with Solana Dominance posting the week’s biggest move at +3.93%, BTCDOM adding +1.08%, and USDTDOM dropping -2.90% as the clearest expression of returning appetite, all while a hot CPI print on Wednesday tested the bid and failed to break it.
2. MACRO CONTEXT — THE BACKDROP
The total crypto market cap opened the week at approximately $2.15T and closed near $2.21T, a gain of roughly +2.8%. That expansion was the primary engine compressing stablecoin dominance and rewarding assets that outran the market. On the price side, SOL led all majors at +7.30%, BTC posted +3.89%, ETH added +2.23%, and BNB gained +2.04%. The context matters: mid-May through early June had been marked by persistent spot BTC ETF outflows totaling roughly $4–5B and an Ethereum ETF outflow streak running approximately 17 consecutive sessions. This week marked the first credible inflection point in that drain.
Wednesday, June 10 provided the sharpest test. US CPI for May printed hotter than expected at +0.5% MoM and +4.2% YoY (energy rising +3.9%), forcing a hawkish Federal Reserve repricing in real time. The dominance charts show the response immediately: USDTDOM spiked to its weekly high of 8.95%, BTCDOM bottomed at 57.97%, and SOLDOM touched its weekly low of 1.73%, all concentrated around June 10–11. The market’s answer to its own question came fast. Rather than sustaining the fear, capital rotated back into risk assets with conviction over the following 48 hours.
The recovery leg is where the week’s character was established. By Sunday’s close, BTCDOM had reclaimed to 59.17%, within a breath of its 59.24% weekly high. SOLDOM closed at 1.85%, just below its 1.86% high. USDTDOM closed at 8.37%, precisely at its weekly low. A hot inflation print midweek, and the week still closed risk-on: that divergence is the headline.
3. ASSET DEEP DIVE
Solana (SOL) Dominance
Open: 1.78% / Close: 1.85% / WoW Change: +3.93%
The Structure
SOLDOM entered the week having spent much of the May–early June period under pressure alongside the broader altcoin complex. The 1.73% level, tested Wednesday, now reads as a meaningful higher low on the weekly frame. The 1.86% intraweek high is the proximate resistance, and 1.90% is the next structural level that would signal a genuine breakout of the recent range. The weekly close at 1.85% keeps the momentum constructive: SOLDOM reclaimed near its high rather than fading into the weekend.
This Week’s Price Action
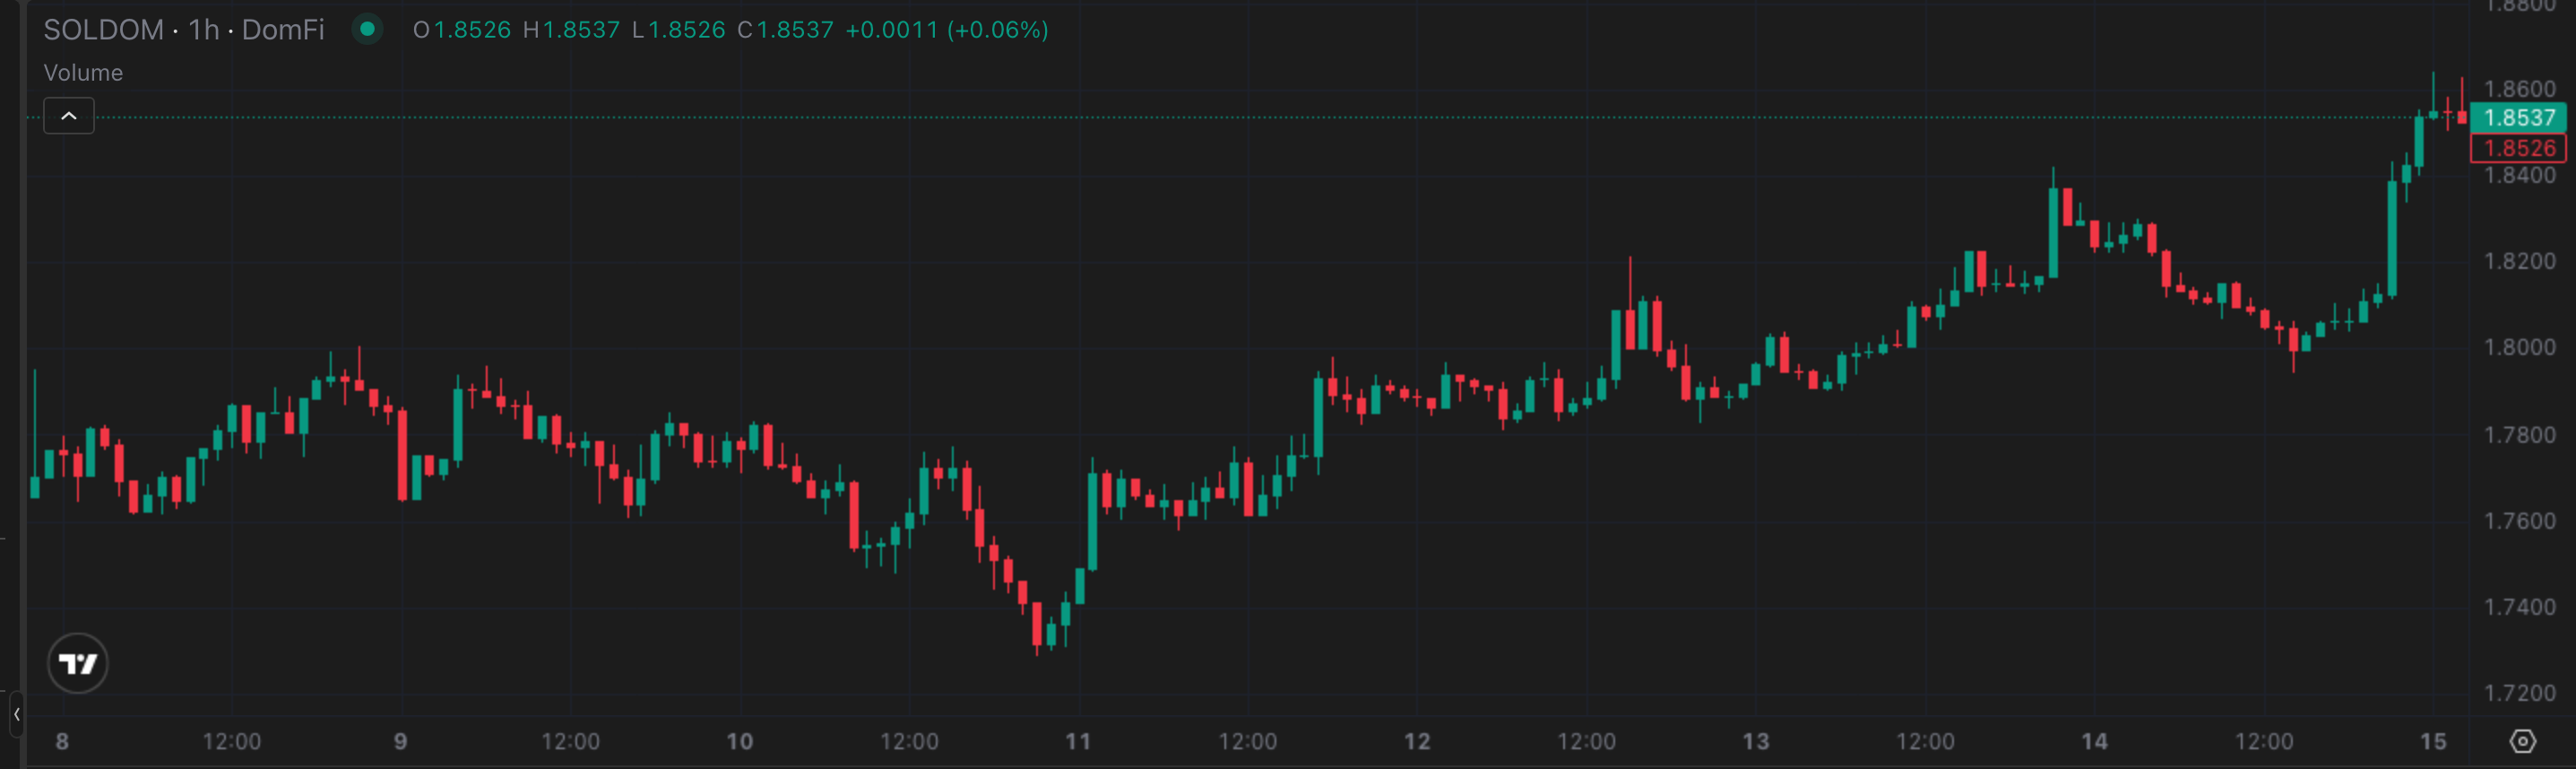
The weekly candle opened at 1.78%, dipped to 1.73% on the CPI shock, and recovered to close 1.85%, just under the 1.86% intraweek peak. The swing of 7.51% across that 1.73%–1.86% range was the widest of any pair this week, reflecting SOL’s elevated sensitivity to macro sentiment swings. The close-near-high structure is the decisive read: sellers showed up Wednesday and were absorbed by the end of the week.
The Daily View
On the daily timeframe, SOLDOM’s trajectory draws a clean V. The June 10–11 flush to 1.73% reversed sharply, with each subsequent daily close printing higher. By Friday, SOLDOM had recovered its weekly open and extended above it. The momentum turn is visible: the intraweek low held, the recovery was orderly, and the close near 1.86% confirms that buyers, not sellers, controlled the back half of the week.
The Why
The catalyst stack behind SOLDOM’s outperformance this week is the most well-defined of any pair. On June 10, the same day the CPI print triggered the risk-off dip, CME announced cash-settled Crypto Index Futures that include SOL alongside BTC and ETH. That announcement is institutionally significant: CME inclusion signals regulatory legitimacy and opens a new channel for institutional exposure without direct spot custody. Separately, anticipation built around the Solana Policy Institute’s “Washington x Wall Street” summit, scheduled for June 16, adding a policy-credibility narrative to the institutional one.
The fundamental backdrop reinforced the case. Solana’s network processed approximately $1.1T in economic activity during Q1 2026, with roughly 4.6 million daily active users. The Alpenglow upgrade, targeting Q3 mainnet, adds a technical roadmap catalyst. These are not imminent events; they are the kind of durable fundamentals that attract capital when macro conditions permit.
The dominance mechanics work on two levels here. SOL’s price gained +7.30%, the best of the majors, so Solana’s individual market cap expanded meaningfully. But the market as a whole grew only approximately +2.8%, which means SOL’s market cap growth far outpaced the aggregate. That gap between asset-level growth and market-level growth is exactly how dominance rises. Capital rotating out of stablecoins (USDTDOM -2.90%) found its highest-beta destination in SOL, amplifying the dominance gain beyond what price alone would suggest.
The Outlook
The bull case is straightforward: a neutral or dovish FOMC decision on June 17, one that does not signal a 2026 rate hike, extends the risk-on rotation. Under that scenario, SOLDOM has a clear path toward 1.90% and potentially above, particularly if the Washington x Wall Street summit produces concrete policy signals. The bear case centers on the FOMC dot plot, which as an SEP meeting carries full projections. Markets are pricing roughly 70% probability of a hike by year-end; a dot plot that pulls that probability higher would reprice risk assets aggressively. In that scenario, SOLDOM retests 1.73%. The level is clean and the stakes are defined.
4. THE DOMINANCE MATRIX
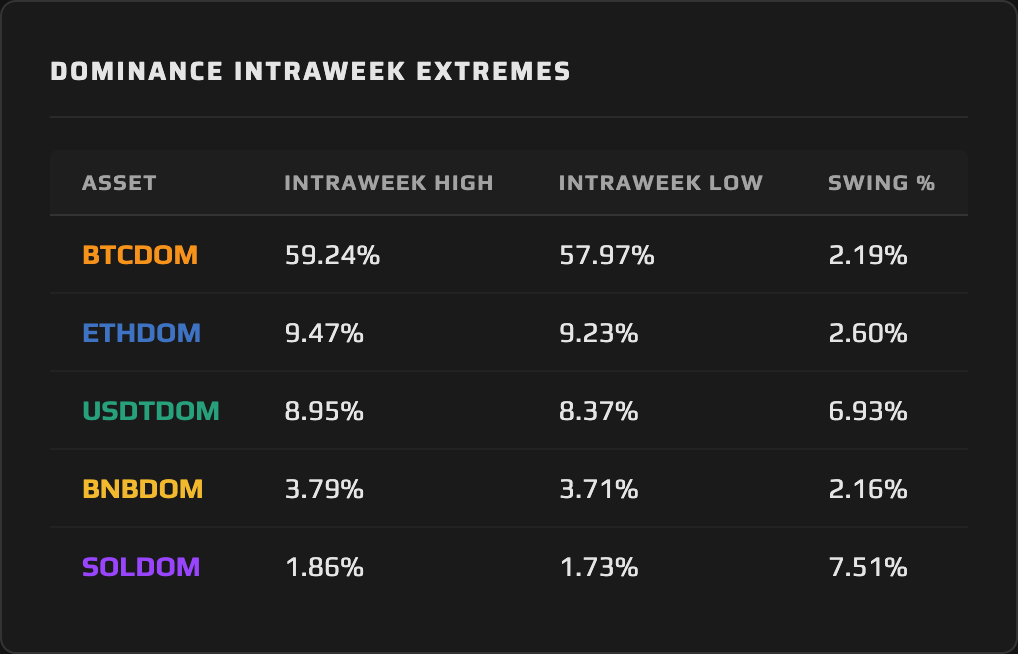
USDTDOM is the week’s defining mover and the sharpest read of market character. Tether Dominance dropped -2.90% from 8.62% to 8.37%, closing precisely at its weekly low after spiking as high as 8.95% during Wednesday’s CPI-driven flight to safety. That 6.93% swing, widest among the stablecoin reading and nearly matched only by SOLDOM, encodes the entire week’s narrative in a single number: capital ran to safety on the CPI print, then reversed completely and finished the week deploying into risk. The aggregate stablecoin market cap moved from roughly $314B to $313B, essentially flat; the compression in USDTDOM came not from stablecoins being sold en masse, but from the total crypto market expanding approximately +2.8% around a steady stablecoin supply. The dominance lens surfaces something price charts alone cannot: the intraweek spike to 8.95% and the hard close at 8.37% tell you exactly when fear entered and when conviction returned.
BTCDOM is the week’s only other gainer at +1.08%, opening 58.54% and closing 59.17%. Bitcoin Dominance played a dual role this week. During the midweek fear, it absorbed a safety bid within crypto; even as BTCDOM dipped to 57.97% on the CPI shock, it recovered faster than ETH or BNB, and its 2.19% swing is tighter than ETH’s 2.60%. BTC’s price gain of +3.89% outran the market’s roughly +2.8% expansion, which is the mechanical reason Bitcoin Dominance added share. The close at 59.17%, just under the 59.24% weekly high, confirms that the quality bid within crypto held through the volatility.
ETHDOM and BNBDOM cluster as the week’s laggards at -0.74% and -0.80% respectively, but the mechanisms are distinct. Ethereum Dominance fell from 9.42% to 9.35% despite ETH gaining +2.23% in price; ETH’s market cap grew, but the market grew faster, and the persistent Ethereum ETF outflow streak running roughly 17 consecutive sessions entering this week continues to weigh on relative performance. ETHDOM’s 2.60% swing (9.23% low to 9.47% high) was actually the widest among the large-caps, reflecting elevated volatility without directional conviction. BNB Dominance fell from 3.76% to 3.73% as BNB added +2.04% in price, also trailing the market’s aggregate gain. BNBDOM’s 2.16% swing was the tightest of the group, reflecting its characteristically lower beta. Both pairs rose in dollar terms and lost in dominance terms: that is the signature of assets that gained, but gained slower than the market they sit inside.
Synthesis: This week’s dominance charts tell a single, decisive story of risk-on rotation, with capital exiting stablecoins (USDTDOM -2.90%) and concentrating in the highest-beta leaders (SOLDOM +3.93%), while BTC held its quality bid (+1.08%) and the laggards lost share despite absolute price gains. The regime confirms when USDTDOM holds at its low and SOLDOM closes near its high, not when they merely spike and fade.
5. THE WEEK AHEAD — EVENTS CALENDAR
Monday, June 15 — StarkNet (STRK) token unlock: $10.96M, approximately 2.02% of circulating market cap | NY Empire State Manufacturing Index (June).
Tuesday, June 16 — FOMC two-day meeting begins | US Retail Sales (May) | US Industrial Production (May) | Arbitrum (ARB) token unlock: $7.71M, approximately 1.50% of circulating market cap | Solana Policy Institute “Washington x Wall Street” summit.
Wednesday, June 17 — FOMC rate decision: 3.50%–3.75% expected hold, with updated Summary of Economic Projections and dot plot (Chair Warsh’s first meeting as chair) | US Housing Starts and Building Permits (May).
Thursday, June 18 — US Initial Jobless Claims | Philadelphia Fed Manufacturing Index (June).
Friday, June 19 — Juneteenth federal holiday; US equity and bond markets closed.
What to Watch for Dominance: Wednesday’s FOMC decision and dot plot are the swing factor for everything that follows. A neutral-to-dovish dot plot extends the rotation: USDTDOM continues bleeding below 8.37% while SOLDOM presses toward 1.90%, sustained by the summit catalyst and CME futures positioning. A hawkish hold, one where the dot plot signals a 2026 rate increase, snaps the risk-on bid, sends capital back to stablecoins, and lifts USDTDOM off its 8.37% low while pressuring SOLDOM back toward the 1.73% CPI-dip low. The regime hangs on those projections.
6. CLOSING REMARK
This week the dominance charts ran a stress test on the returning bull narrative and, mostly, it passed. A hot CPI print on Wednesday, +4.2% YoY and +0.5% MoM, was the kind of data point a fragile market capitulates on. Instead, the dominance picture snapped back with conviction: SOLDOM recovered from 1.73% to close 1.85%, USDTDOM reversed its fear spike from 8.95% to close at its 8.37% low, and BTCDOM held above 59% into the weekend close. The capital rotation out of stablecoins and into risk was not merely a pre-CPI setup that broke on the print. It resumed immediately after. Standard Chartered’s Geoffrey Kendrick put language to the shift on June 12, calling a cycle low near $59,000 for BTC and declaring crypto winter over, a reversal of his own earlier $50,000 target. That call does not make it so, but it reflects a sentiment inflection visible in the dominance data.
The confirmation round comes Wednesday. If FOMC delivers a hold without a hawkish dot plot, the rotation has its runway, and USDTDOM below 8.50% is the regime signal to watch. A reclaim of 8.50% by USDTDOM is the first clean indication that the safety bid is returning and the risk-on rotation is fading. Until then, the dominance charts read risk-on, and SOLDOM at +3.93% is the sharpest expression of where conviction is concentrating.
This content is produced by domination.finance for informational and educational purposes only. Nothing contained herein constitutes financial or investment advice. Always conduct your own research.