Dominance Debrief #12
The crypto complex sold off hard — total market cap down \~12.4%, BTC down 14.02%, SOL down 19.38%. Every risk pair bled share. USDTDOM was the sole winner, surging +13.40% as capital fled alts, then BTC, then landed in stables. Pure flight-to-safety.
THE DOMINANCE DEBRIEF
Week of June 1 – June 7, 2026
Issue #12
TL;DR: The crypto complex sold off hard — total market cap down ~12.4%, BTC down 14.02%, SOL down 19.38%. Every risk pair bled share. USDTDOM was the sole winner, surging +13.40% as capital fled alts, then BTC, then landed in stables. Pure flight-to-safety.
1. THE WEEK IN DOMINANCE
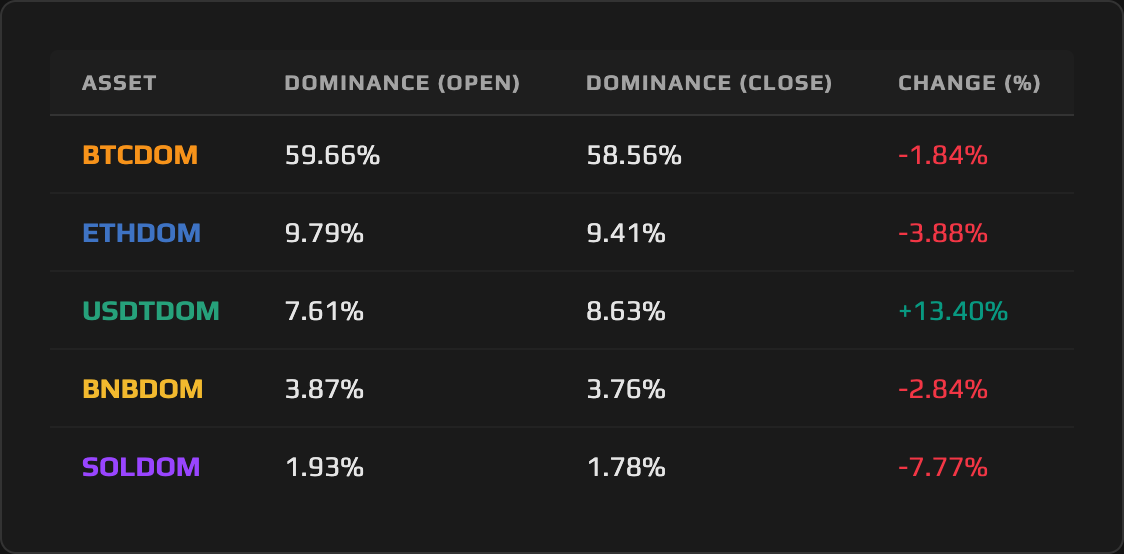
This was a deleveraging week: across every risk pair, dominance contracted as a blowout jobs print reinforced the higher-for-longer rate narrative, $3 billion in spot BTC ETF outflows extended a losing streak, and over $1.5 billion in positions liquidated in a single session. USDTDOM absorbed it all, gaining +13.40% as the only pair on the board that ends a crash week in the green.
2. MACRO CONTEXT — THE BACKDROP
Total crypto market capitalization fell from approximately $2.45 trillion to $2.14 trillion across the week, with an intraweek low near $2.18 trillion on June 4. The proximate trigger was Friday’s May Nonfarm Payrolls print: +172,000 jobs against an +80,000 consensus, with unemployment holding at 4.3% and average hourly earnings running +0.3% month-over-month. A blowout labor market in the face of sticky energy-driven inflation — Strait of Hormuz tensions kept gasoline elevated, and the University of Michigan consumer sentiment index had already cratered to a record-low 44.8 in May — pushed Fed-cut expectations materially further out, repricing risk assets across the board.
Crypto-specific catalysts compounded the macro overhang. Reports emerged around June 1 that Strategy, the corporate Bitcoin holder that had become synonymous with a “permanent bid” thesis, sold Bitcoin for the first time in roughly four years, a sentiment shock that rattled confidence in the institutional accumulation narrative. Spot BTC ETFs simultaneously bled approximately $3 billion across ten consecutive sessions, removing a structural source of demand exactly when price momentum was already negative. The combination produced the single-day liquidation cascade mid-week, with longs absorbing the bulk.
The regime read is unambiguous: this was not sector rotation. Every risk pair lost share simultaneously. The capital flight was laddered, out of altcoins first, toward BTC, and ultimately into stablecoins, and USDTDOM captured the entirety of the move. The turn signal will be a week in which Bitcoin Dominance posts a gain while Tether Dominance contracts; that has not happened.
3. ASSET DEEP DIVE
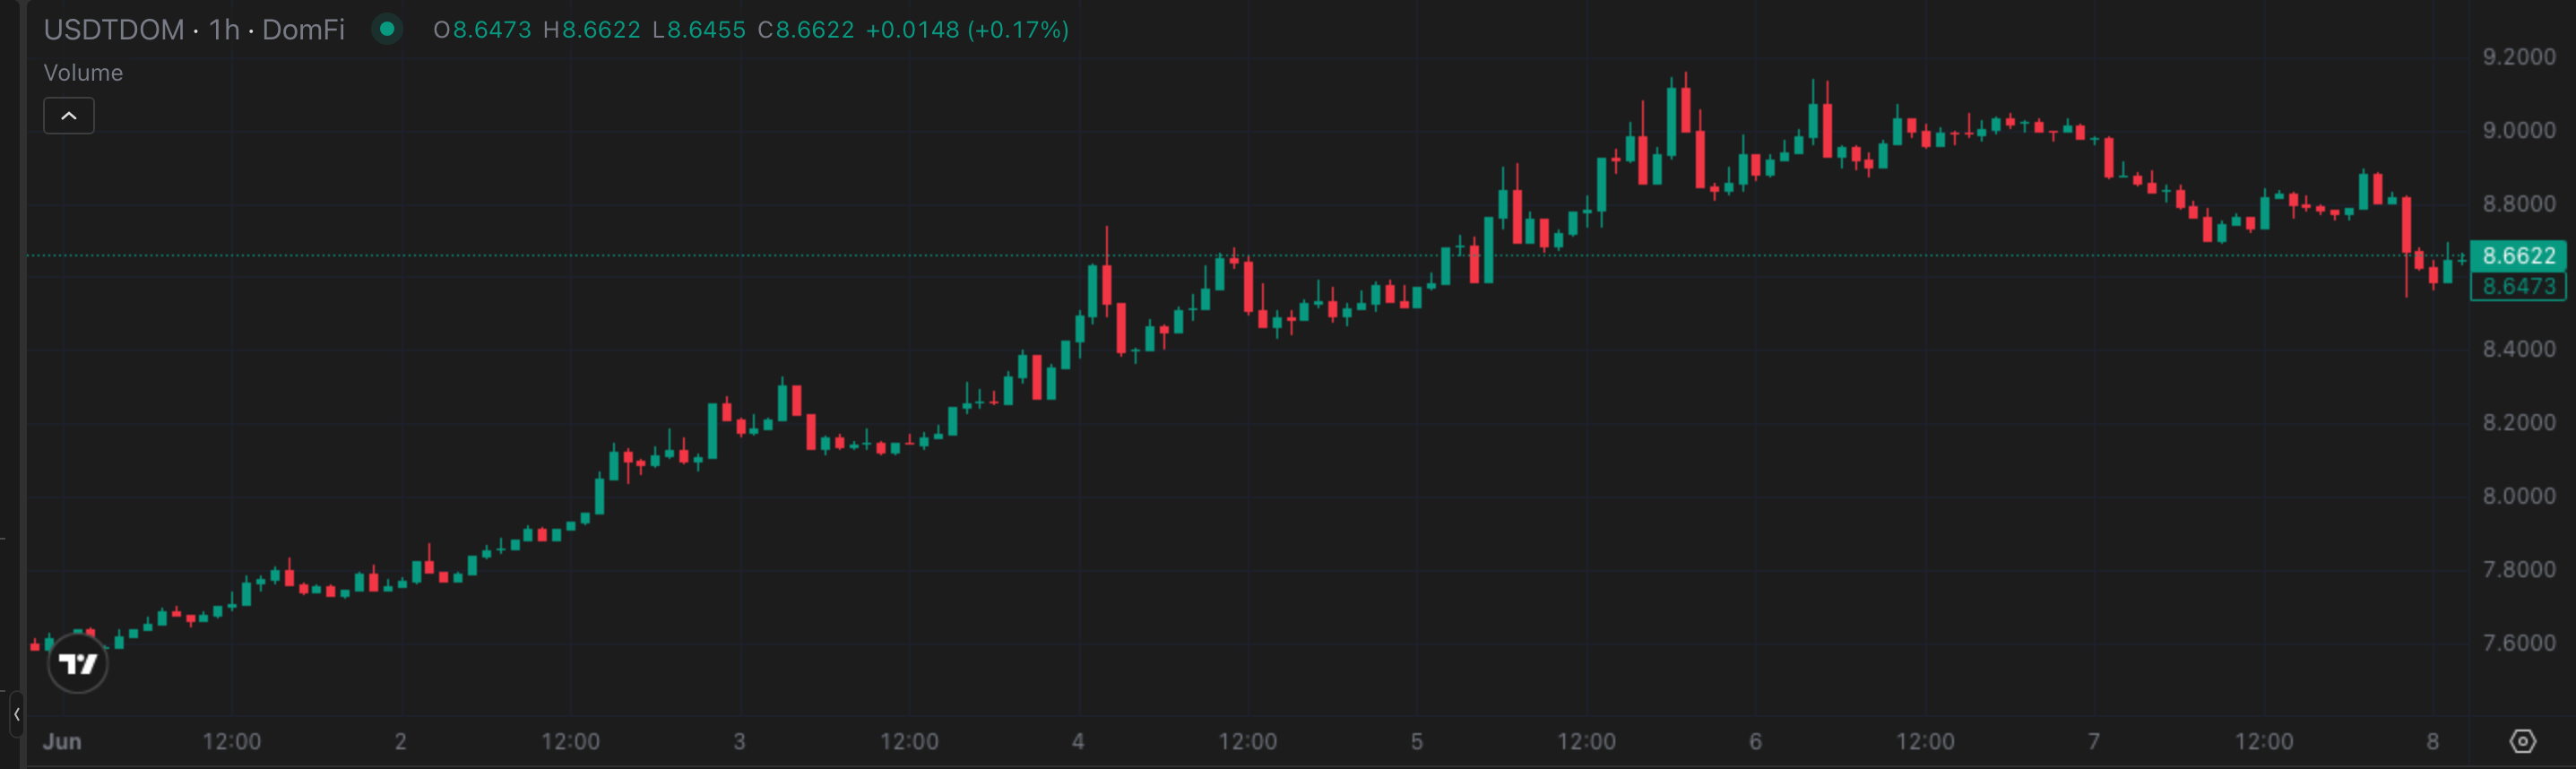
Tether (USDT) Dominance
Open: 7.61% / Close: 8.63% / WoW Change: +13.40%
The Structure
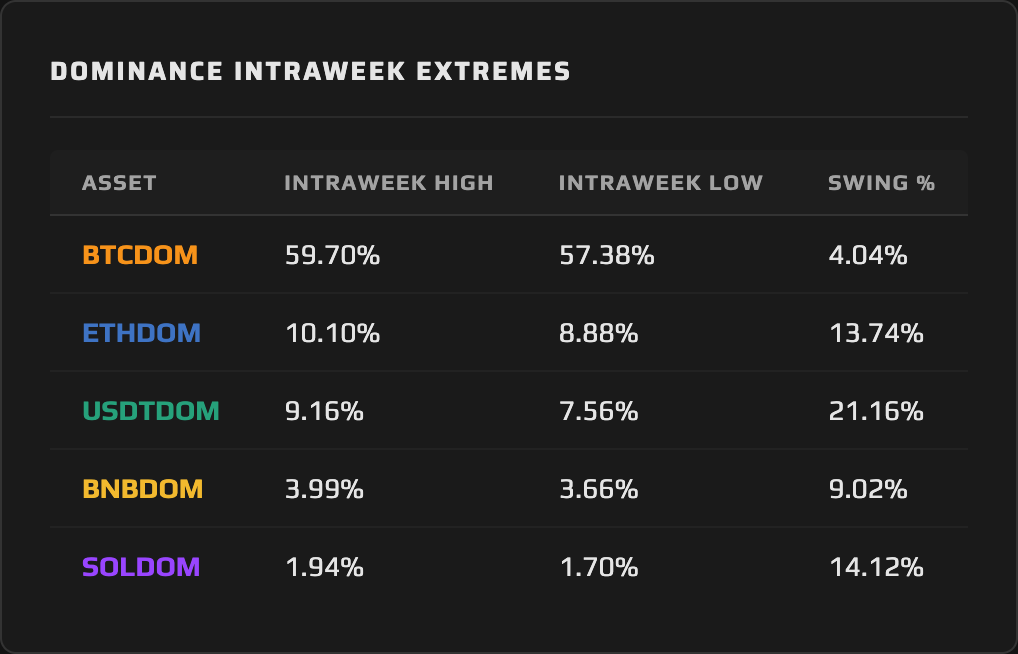
USDTDOM entered the week at 7.61%, below the psychologically significant 8.00% level. The pair had been range-bound in the high-7% to low-8% zone through the tail of May, reflecting a market that, while cautious, had not yet broken into full flight-to-safety mode. The intraweek swing of 21.16%, the widest of any pair this week, captures how quickly that changed.
This Week’s Price Action
From the 7.61% open, Tether Dominance climbed steadily through Monday and Tuesday as the macro narrative began to tighten. By Wednesday it had reached approximately 8.33%, already through the 8.00% level that now becomes near-term support. The Thursday/Friday capitulation cascade, triggered by the NFP print and the ensuing liquidation waterfall, sent USDTDOM spiking to its intraweek high of 9.16%, tagging above the round 9.00% level intraday. The close came in at 8.63%, pulling back from that spike but still holding well above the 8.00% breakout zone. The intraweek low was 7.56%, set early in the week before the macro fuse was lit.
The Daily View
The daily progression tells the story in two acts. Act one was the slow grind: each session added a few ticks as nervous positioning built ahead of the jobs print and as the ETF outflow streak continued to mount. Act two was the snap: the NFP beat landed, leveraged longs were flushed, and USDTDOM went vertical in a matter of hours. The 9.16% tag was a capitulation high, reflecting peak fear, not a new structural range. The subsequent pullback to 8.63% on the weekly close confirms that at least some risk appetite returned once the liquidation cascade cleared, but not enough to reclaim the sub-8.00% levels that characterized the prior equilibrium.
The Why
The analytical centerpiece here is not what you might assume. USDTDOM surging +13.40% in a single week could suggest massive fresh stablecoin minting: a wave of capital converting risk assets into USDT, inflating the aggregate float. The data tells a different story. The aggregate stablecoin market cap, measured across the entire stablecoin complex rather than USDT alone, moved from approximately $318.16 billion on June 1 to $314.49 billion on June 7, a slight contraction of roughly 1.2%. There was no meaningful issuance surge.
What drove the +13.40% gain was overwhelmingly the collapse of everything priced against USDT. Tether’s market cap held roughly steady while the total crypto market shrank approximately 12.4%, mechanically lifting Tether Dominance from both sides. This is the dual mechanism operating in its purest form. USDT’s share of the total market expanded not because more dollars poured into Tether, but because the assets surrounding it fell away. The stablecoin float’s relative stability in the face of violent price destruction is itself a signal worth reading: capital did not immediately re-enter risk, but neither did it deploy fresh stablecoin liquidity at scale. It simply held position while everything else dropped.
One additional nuance the dominance lens surfaces: the aggregate stablecoin complex is exactly that, aggregate. Intra-stablecoin dynamics, such as USDT gaining share within the category while USDC or other venues shed it, would be a layered signal on top of the headline dominance read, and are worth tracking in the weeks ahead as the market stabilizes.
The Outlook
The May CPI print on Wednesday, June 10 is the pivot. A hot core, above the +0.2% month-over-month consensus, would validate the higher-for-longer repricing and keep the safe-haven bid alive, putting 9.00% back in play as a near-term target for USDTDOM. A soft core at or below consensus is the first plausible trigger for stablecoin-to-risk rotation that would pull Tether Dominance back toward 8.00% support. The structural floor from the week’s open, approximately 7.60%, should not come into view unless a CPI miss arrives alongside a genuine risk-on catalyst. The 8.63% close is the line of control: a weekly close back below 8.00% signals the flight trade is unwinding; a weekly close above 9.00% confirms a new range.
4. THE DOMINANCE MATRIX
The four remaining pairs all moved in the same direction: down. The differentiation is in the magnitude, and magnitude here reveals the internal architecture of a deleveraging event.
Solana Dominance was the week’s clearest outlier, shedding 7.77% to close at 1.78%. SOL as an asset fell 19.38% on the week, touching approximately $61 intraday on June 6, its lowest price level since November 2023. The intraweek swing of 14.12% reflects SOLDOM’s sensitivity in both directions, but this week there was no floor. Critically, US spot Solana ETFs flipped to net outflows this week after a sustained run of inflows, stripping away the institutional support narrative at exactly the moment the broader complex was deleveraging. When the one structural bid that had distinguished SOL from its peer group reversed, the pair repriced sharply.
Ethereum Dominance tells a more nuanced story. ETHDOM opened at 9.79% and actually climbed to an intraweek high of 10.10% in the early sessions, briefly outperforming Bitcoin Dominance as money rotated from lower-cap risk. That resilience evaporated as the unwind deepened: ETHDOM bottomed at 8.88% before recovering to a 9.41% close, for a WoW move of 3.88% and a swing of 13.74%. The swing is wider than BNBDOM’s, reflecting the early-week premium followed by the late-week catch-up selling.
BNB Dominance contracted 2.84% to 3.76%, with a swing of 9.02%. As an exchange token, BNBDOM tends to track the broader risk complex without the beta amplification that smaller positions carry, and that held true here: the loss was real, but the move was contained relative to SOLDOM and ETHDOM.
Bitcoin Dominance was, among the risk pairs, the week’s relative story. BTCDOM fell 1.84% to close at 58.56%, but the intraweek path matters as much as the closing number. Bitcoin Dominance bottomed at 57.38% during the capitulation before recovering into the 58.56% close, a rebound of more than 2% off the lows within the same week. The 4.04% intraweek swing is the tightest of any pair. That recovery-into-the-close is the clearest evidence of the laddered flight dynamic: as alts bled faster than BTC, capital moved toward Bitcoin as the relative safe harbor within the risk asset class before ultimately reaching stables.
The matrix synthesis: this was one regime, one direction. The flight was laddered, out of alts first, toward BTC, and finally into stables. Every pair confirms the same read, and the regime does not change until Bitcoin Dominance posts a weekly gain while USDTDOM contracts.
5. THE WEEK AHEAD — EVENTS CALENDAR
Wednesday, June 10 — US CPI (May) (Consensus core: +0.2% m/m, +2.8% y/y | Prior core: +0.4% m/m). 8:30am ET.
Thursday, June 11 — US PPI (May) | Initial Jobless Claims.
Friday, June 12 — University of Michigan Consumer Sentiment, preliminary June (Prior: 44.8) | Pump.fun token unlock (~1% of supply) | Aptos (APT) token unlock (~0.54% of supply) | Weekly crypto options expiry.
What to Watch for Dominance
Wednesday’s CPI print is the week’s swing factor. A hot, energy-driven core reading above the +0.2% consensus would validate the higher-for-longer repricing that drove this week’s crash, keeping the safe-haven bid intact and putting USDTDOM back on a path toward the 9.00% level it tested intraweek. In that scenario, BTCDOM and SOLDOM face renewed pressure. A soft core print at or below consensus is the first plausible catalyst for a stablecoin-to-risk rotation: USDTDOM would likely pull back toward the 8.00% near-term support zone, while BTCDOM has room to press higher if the recovery-into-close momentum from this week extends.
6. CLOSING REMARK
The week of June 1 through June 7 was a textbook dominance case study in how capital moves when leverage unwinds. The rotation was not from one sector to another; it was a sequential evacuation. Alts bled first and deepest. SOLDOM’s 7.77% move, punctuated by SOL’s lowest price since late 2023 and the reversal of ETF inflows, captures that tier of the flight cleanly. BTC absorbed some of that displaced capital, keeping Bitcoin Dominance’s loss to 1.84% and producing a genuine recovery off the intraweek lows. Ultimately, the destination was stables: USDTDOM’s +13.40% gain, driven overwhelmingly by a shrinking total market against a steady stablecoin float, reflects a market that wanted safety, not risk-asset exposure of any kind.
The dominance charts for next week will be shaped almost entirely by Wednesday’s CPI print. If the data endorses higher-for-longer, the flight trade persists and USDTDOM presses toward 9.00%. If it doesn’t, the laddered rotation runs in reverse. Watch for BTCDOM posting a weekly gain while USDTDOM contracts; that pairing, when it finally appears, is the cleanest signal that the regime has shifted.
This content is produced by domination.finance for informational and educational purposes only. Nothing contained herein constitutes financial or investment advice. Always conduct your own research.