Dominance Debrief #11
BNBDOM exploded +11.21% on the VBNB ETF launch — the week's dominant story by a wide margin. BTCDOM and ETHDOM ceded share, USDTDOM gained +2.01% on a defensive bid. Event-driven concentration, not broad rotation.
THE DOMINANCE DEBRIEF
Week of May 25 – May 31, 2026
Issue #11
BNBDOM exploded +11.21% on the VBNB ETF launch — the week’s dominant story by a wide margin. BTCDOM and ETHDOM ceded share, USDTDOM gained +2.01% on a defensive bid. Event-driven concentration, not broad rotation.
1. THE WEEK IN DOMINANCE
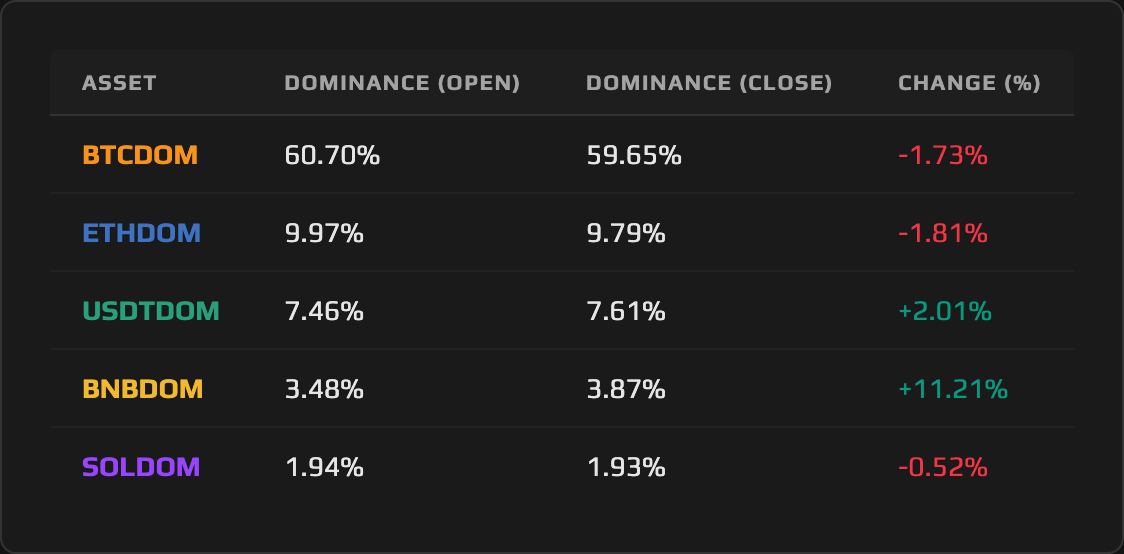
A de-risking week for the broad market produced one of the sharpest event-driven concentrations of the year: the total crypto market fell −2.76% as BTC, ETH, and SOL all bled in price, yet BNB Dominance surged +11.21% on the launch of the first U.S. spot BNB ETF, BNBDOM ending the week at 3.87% after opening at 3.48%. USDTDOM captured the defensive bid, rising +2.01% to 7.61%. Bitcoin Dominance and Ethereum Dominance absorbed the outflows on the other side, each shedding roughly −1.7–1.8%. This was not a clean macro rotation and not a broad risk-off flush: it was capital crowding into a single idiosyncratic catalyst and into safety, draining the incumbents in the process.
2. MACRO CONTEXT — THE BACKDROP
The macro tape turned defensive early in the week. Uncertainty over the timing of Federal Reserve rate cuts deepened alongside weakness in tech and AI equities, pushing speculative capital toward the exits. The total crypto market capitalization contracted from approximately $2.52 trillion to $2.45 trillion, a loss of roughly −2.76% on the week. The Fear and Greed Index hovered in “Fear” territory for most of the period, printing in the 25–28 range as the weekend approached, with a 7-day average of 26 and a 30-day average of 34. Capital that rotated out of crypto largely went into AI equities and precious metals, two of the cleaner safe-haven plays available during a rate-uncertainty regime.
The week also produced the worst crypto ETP outflow reading of 2026. Roughly $1.47 billion left crypto exchange-traded products over the period, with a single approximately $1.29 billion block sale from the spot BTC ETF IBIT accounting for the bulk of it. That transaction reads as managed distribution, a large holder executing a structured rotation out, not panic liquidation. The distinction matters for interpreting BTCDOM’s decline: the major’s dominance fell, but the selling was deliberate and orderly, not the chaotic capitulation the Fear and Greed level might imply.
Against that backdrop, BNB was the lone major to print a positive price week, rising +8.10% entirely on its own idiosyncratic catalyst: the May 28 launch of VBNB. The divergence between BNB and the rest of the market was not a macro story at all. It was a regulatory milestone landing in the middle of a de-risking tape, pulling fresh regulated demand into a market that was otherwise shedding it.
3. ASSET DEEP DIVE
BNB (BNBDOM) Dominance
Open Price: 3.48% / Close Price: 3.87% / WoW Change: +11.21%
The Structure
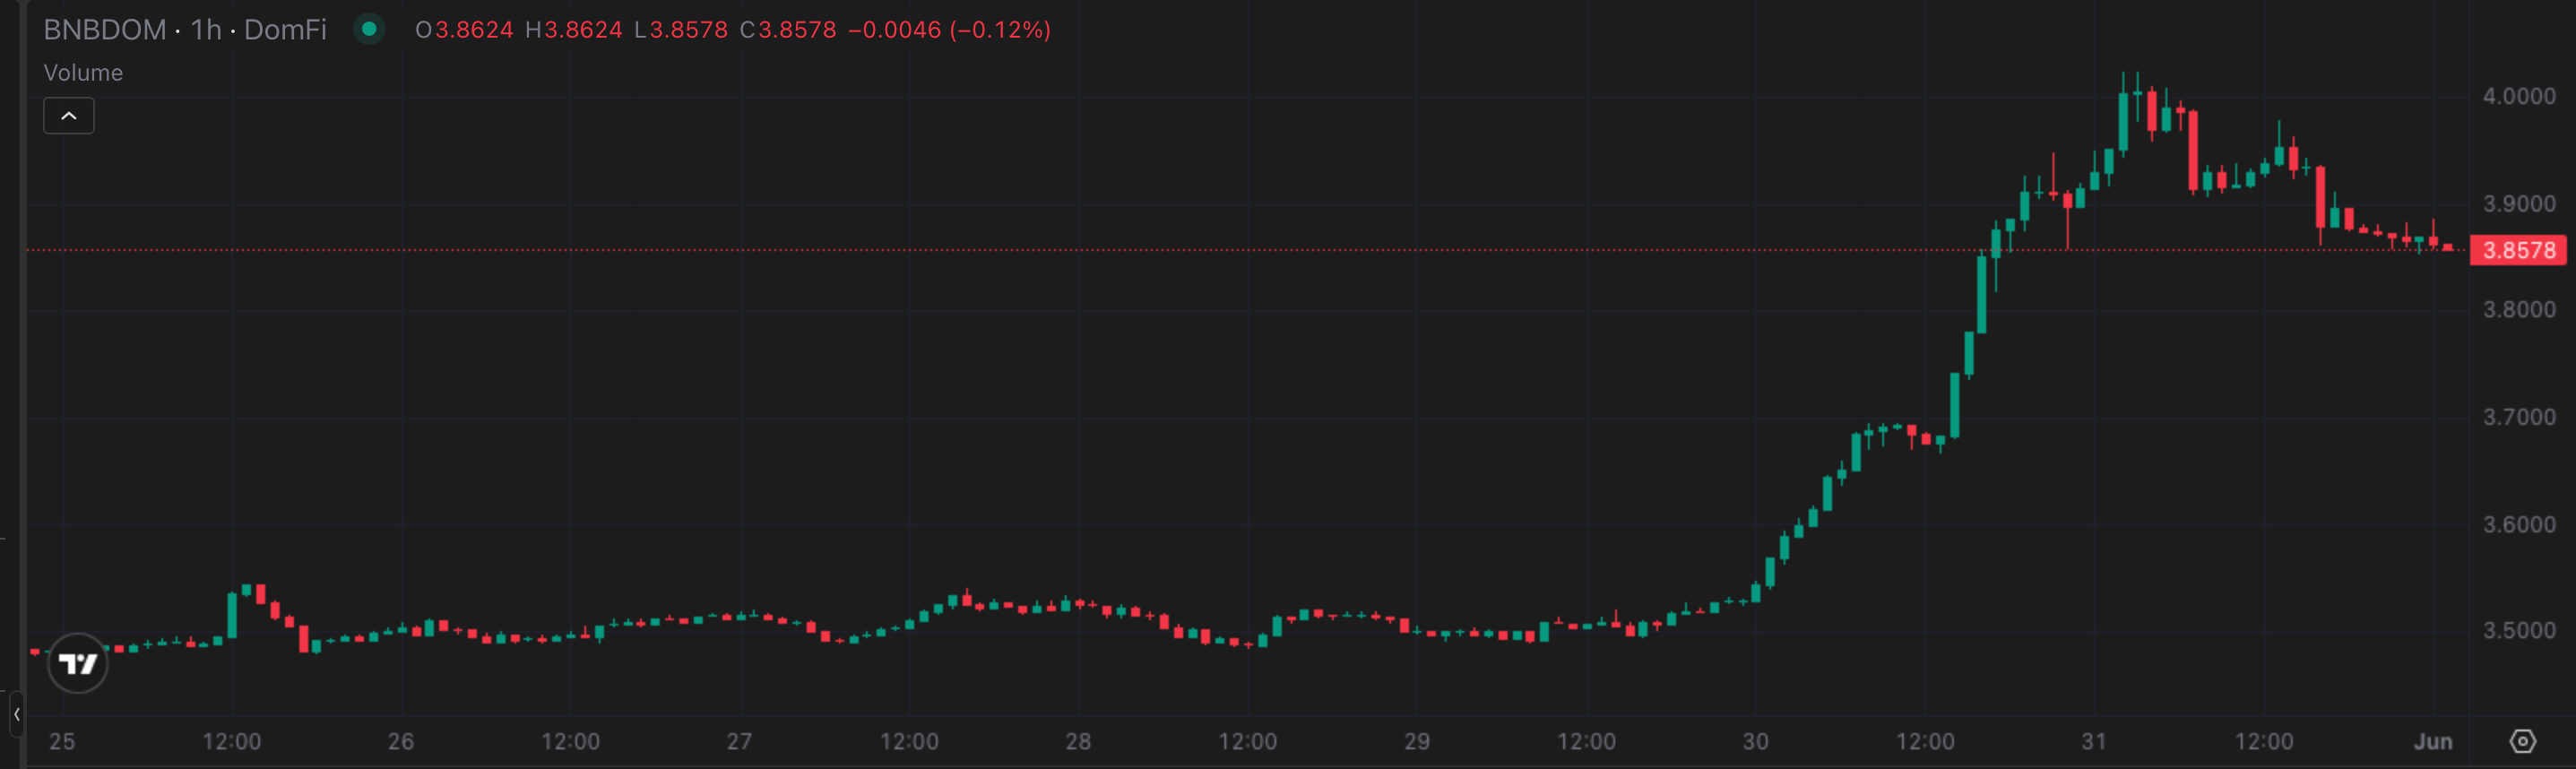
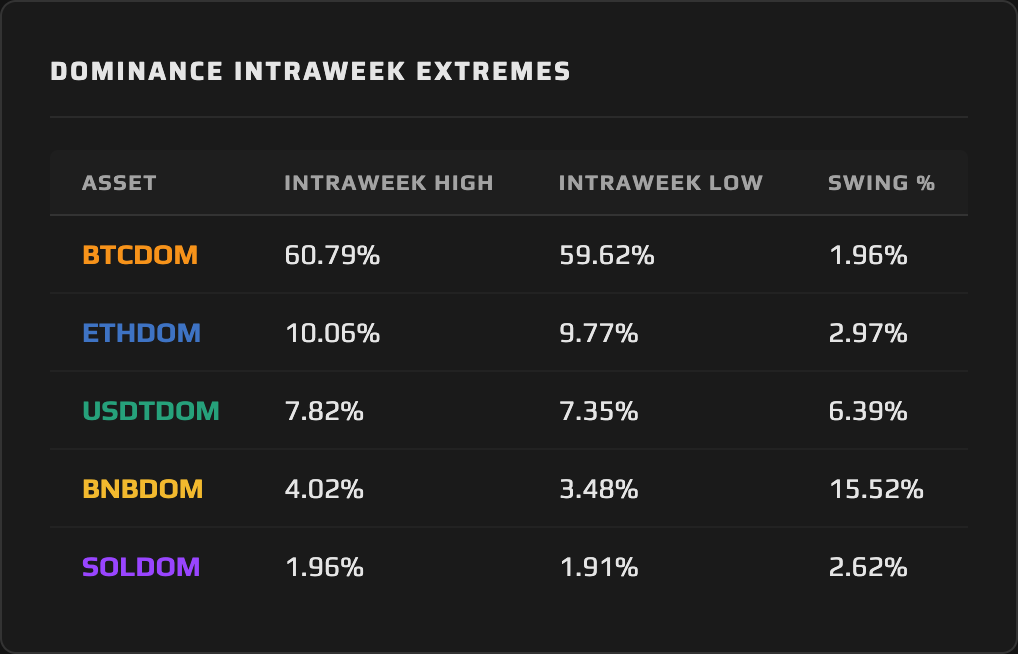
BNB Dominance entered the week at 3.48%, essentially the floor of a multi-week consolidation range. The 3.48%–3.51% zone had defined the base of the range in the days prior, and through the first two-thirds of this week, BNBDOM held flat within it, trading sideways as the broader market came under pressure. The range was a coiled structure waiting for a catalyst. When the catalyst landed, the move was decisive. BNBDOM expanded vertically in the final third of the week, reaching an intraweek high of 4.02% before closing at 3.87%. The 15.52% swing, widest of any pair this week by a material margin, shows how quickly a structural break can develop when a genuine, non-speculative catalyst hits a market already under supply pressure.
This Week’s Price Action
The first two days of the week were quiet for BNB Dominance. BNBDOM tracked near its open of 3.48%, showing no meaningful directional bias even as BTCDOM and ETHDOM drifted lower. The divergence became apparent on May 28, when VBNB began trading: BNB’s price recovered from early-week pressure and ultimately closed the week at $709.25 versus a $656.08 open, a gain of +8.10%. BNBDOM’s intraweek high of 4.02% was reached as that price move was at its most aggressive; the close at 3.87% reflects a partial fade from the intraday high as some early buyers trimmed. The 4.02% level is now the first overhead test; 3.87% is the shelf the market needs to hold to validate the structural break.
The Daily View
The daily cadence reinforces a clear pre-catalyst versus post-catalyst narrative. BNBDOM was flatlined through Monday, Tuesday, and most of Wednesday, range behavior that tracked the broader market’s defensive tone. The vertical expansion starting Thursday reflects a crowded entry into a genuinely new market structure: a U.S.-regulated spot ETP for BNB, with institutional distribution channels that did not exist the week before. Friday’s close at 3.87% represents consolidation, not reversal: the pair held above the midpoint of its weekly range and well above the 3.48%–3.51% base.
The Why
Two forces drove BNBDOM higher simultaneously, and collapsing them into one explanation would miss the story. BNB’s own market value expanded sharply on fresh regulated ETP demand, physically backed, cold-storage custody, 0.39% management fee, at the exact moment the total crypto market was contracting by −2.76%. BNB’s slice of the pie grew while the pie itself shrank, so BNBDOM was lifted from both sides at once. Remove either force and the move is smaller. Together, they produced the week’s largest dominance gain by a wide margin. The prior supply backdrop reinforced the setup: the 35th quarterly BNB auto-burn, approximately 1.57 million BNB or roughly $1 billion at current prices, completed in April. That standing supply-tightening mechanism didn’t cause this week’s move, the ETF launch did, but it meant the market BNB Dominance absorbed new demand into was already tighter on the supply side.
The Outlook
The key level is 3.87%, the weekly close. If VBNB inflows prove durable through the first weeks of trading, BNBDOM holds above that shelf and builds a case for pressing the 4.02% intraweek high. A clean break of 4.02% would open space for further expansion with no immediate structural resistance established. The bear case is a classic launch-day pop that fades: if regulated demand trails off after initial allocation activity, BNBDOM could retrace toward the ~3.50% pre-breakout base as the idiosyncratic catalyst becomes fully priced. The deciding factor is flow, not price: watch VBNB’s daily AUM trajectory in the first two weeks, not BNB’s spot price.
4. THE DOMINANCE MATRIX
The Decliners: ETHDOM and BTCDOM
Ethereum Dominance fell −1.81% on the week, closing at 9.79% after opening at 9.97%. Its intraweek high of 10.06% was brief and fleeting; the pair spent most of the week trading toward its 9.77% low, producing a swing of 2.97%. ETHDOM tagged the 10% line only in passing, making that level a clean rejection point rather than a base of support. Bitcoin Dominance shed −1.73%, opening at 60.70% and closing at 59.65%. The structure matters here: BTCDOM printed an intraweek high of 60.79%, which means it barely extended above its open before reversing. The close at 59.65%, together with the intraweek low of 59.62%, confirms that BTCDOM lost the 60% handle this week. That loss is meaningful not as a catastrophic structural break but as a near-term directional signal. The 60% zone held on the open; it did not hold on the close. The $1.29 billion IBIT block sale was the dominant flow event for BTCDOM: orderly, managed, but still a net drain on Bitcoin’s share.
Both majors ceded dominance for the same fundamental reason. In a week where the total market contracted while BNB and USDT absorbed concentrated inflows, something had to give. The large incumbents, Bitcoin Dominance and Ethereum Dominance, provided the supply. No asset-specific negative catalyst hit either BTCDOM or ETHDOM directly; the capital simply preferred BNB’s ETP catalyst and USDT’s safety bid over the established majors.
The Safety Bid: USDTDOM
Tether Dominance gained +2.01% on the week, moving from 7.46% to 7.61%. The intraweek path is instructive: USDTDOM spiked to a high of 7.82% as risk-off sentiment peaked midweek, then pulled back as the BNB ETP bid drew some capital back toward risk late in the week. The swing of 6.39% is the second-widest of any pair this week, behind BNBDOM’s 15.52%, and reflects how sharply the defensive bid peaked and then partially unwound. USDTDOM’s gain was a classic flight-to-safety dominance signal: total crypto supply contracted, and a meaningful portion of the capital seeking lower risk concentrated into the stablecoin. Aggregate stablecoin market cap (the full stablecoin universe, distinct from USDT alone) moved from approximately $321.06 billion to $318.49 billion over the period, a slight contraction of −0.80%, which means USDTDOM’s gain reflects USDT gaining share within the stablecoin category even as the category’s aggregate market value edged lower. Intra-stablecoin dynamics are a dominance story within the dominance story: USDT outperforming the aggregate stablecoin basket in a risk-off week is precisely the kind of signal the dominance lens is built to surface.
The Anchor: SOLDOM
Solana Dominance was the quiet outlier in the other direction: it fell only −0.52%, from 1.94% to 1.93%, despite SOL’s price dropping −3.44% on the week. Its intraweek swing of 2.62% was the tightest of the major pairs, and its closing change was the smallest of the decliners. SOLDOM did not benefit from a catalyst and did not absorb a special flow event; it simply held its share better than Bitcoin Dominance and Ethereum Dominance did in a week that hit every major. The resilience suggests that Solana’s market cap declined roughly in line with the total market, neither outperforming on the downside nor attracting idiosyncratic inflows.
Synthesis: The full picture is event-driven concentration, capital crowding into a single idiosyncratic catalyst and into safety, draining the incumbent majors, rather than a broad macro rotation or clean risk-off regime.
5. THE WEEK AHEAD — EVENTS CALENDAR
Monday, June 1 — ISM Manufacturing PMI (May) (Prior: 52.7)
Tuesday, June 2 — JOLTS Job Openings (April)
Wednesday, June 3 — ADP National Employment Change (May) (Prior: +109K) | ISM Services PMI (May)
Thursday, June 4 — Initial Jobless Claims
Friday, June 5 — Nonfarm Payrolls (May) | Unemployment Rate | Average Hourly Earnings
On the crypto calendar, the week is genuinely light. The Deribit monthly expiry fell on May 29, outside this window; the next quarterly is June 26. The one notable unlock is a SUI token release on Monday, June 1: 44,000,000 SUI, approximately 1.32% of circulating supply. No major protocol upgrades, ETF decision deadlines, or governance votes of primary significance fall in this window.
What to Watch for Dominance: Friday’s Nonfarm Payrolls print is the pivotal data point for the week. A strong payrolls read with low unemployment pushes Fed rate-cut expectations further out, extends the defensive bid, and could drive USDTDOM back toward its 7.82% intraweek high while keeping pressure on BTCDOM below the 60% handle. A soft print revives risk appetite and gives Bitcoin Dominance the conditions to reclaim 60%, with USDTDOM likely fading the safety premium it built this week. For BNBDOM specifically, the 3.87% weekly close is the shelf: sustained VBNB inflows in the ETF’s first full trading week hold it and press the 4.02% high, while a flow shortfall returns the pair to the ~3.50% base.
6. CLOSING REMARK
The week of May 25 illustrated what event-driven dominance concentration looks like in real time. A single regulatory milestone, the launch of VBNB, landed in the middle of a de-risking tape and produced the week’s dominant dominance story, not despite the macro headwinds but in part because of them. When the total market contracts, an asset with genuine fresh demand doesn’t just hold its share; it expands it faster, because both forces are working in the same direction. BNBDOM’s 15.52% intraweek swing in a week when the next-widest swing was USDTDOM at 6.39% tells you how asymmetric the catalyst distribution was.
The more durable question the week leaves open is what happens to dominance regimes when ETF-driven demand starts affecting assets beyond BTC and ETH. Bitcoin Dominance and Ethereum Dominance have been the primary beneficiaries of regulated product flows since 2024. BNBDOM’s move this week is a data point, one week and one catalyst, but it points toward a structural dynamic worth watching: as the ETP market broadens, dominance can shift in concentrated, non-linear bursts rather than through the slow-grinding macro rotations the majors have historically produced. The dominance charts are telling you to stay calibrated for event risk, not just macro drift.
This content is produced by domination.finance for informational and educational purposes only. Nothing contained herein constitutes financial or investment advice. Always conduct your own research.