Trades of the Week #7
Five trades, five take-profits, three of them triple-digit returns. Dominance Trades of the Week lays out the level, the stop and the size behind each one.
DOMINANCE TRADES OF THE WEEK
September 10 – 17, 2026
Edition #7
Five trades, five take-profits, three of them triple-digit returns. Dominance Trades of the Week lays out the level, the stop and the size behind each one.
| Pair | Direction | Leverage | Entry | Exit | Net Return | Hold |
|---|---|---|---|---|---|---|
| USDTDOM | Market long | 100x | 6.9670 | 7.1800 | +305.8% | 14h 48m |
| BNBDOM | Market long | 75x | 3.6228 | 3.7000 | +159.8% | 18h 19m |
| ETHDOM | Market short | 35x | 11.8500 | 11.3800 | +138.8% | 4d |
| SOLDOM | Market long | 40x | 2.2532 | 2.2800 | +47.6% | 1h 1m |
| BTCDOM | Limit short | 45x | 59.2000 | 58.9000 | +22.8% | 1d 2h |
1. Tether Dominance (USDTDOM) — Long, Closed
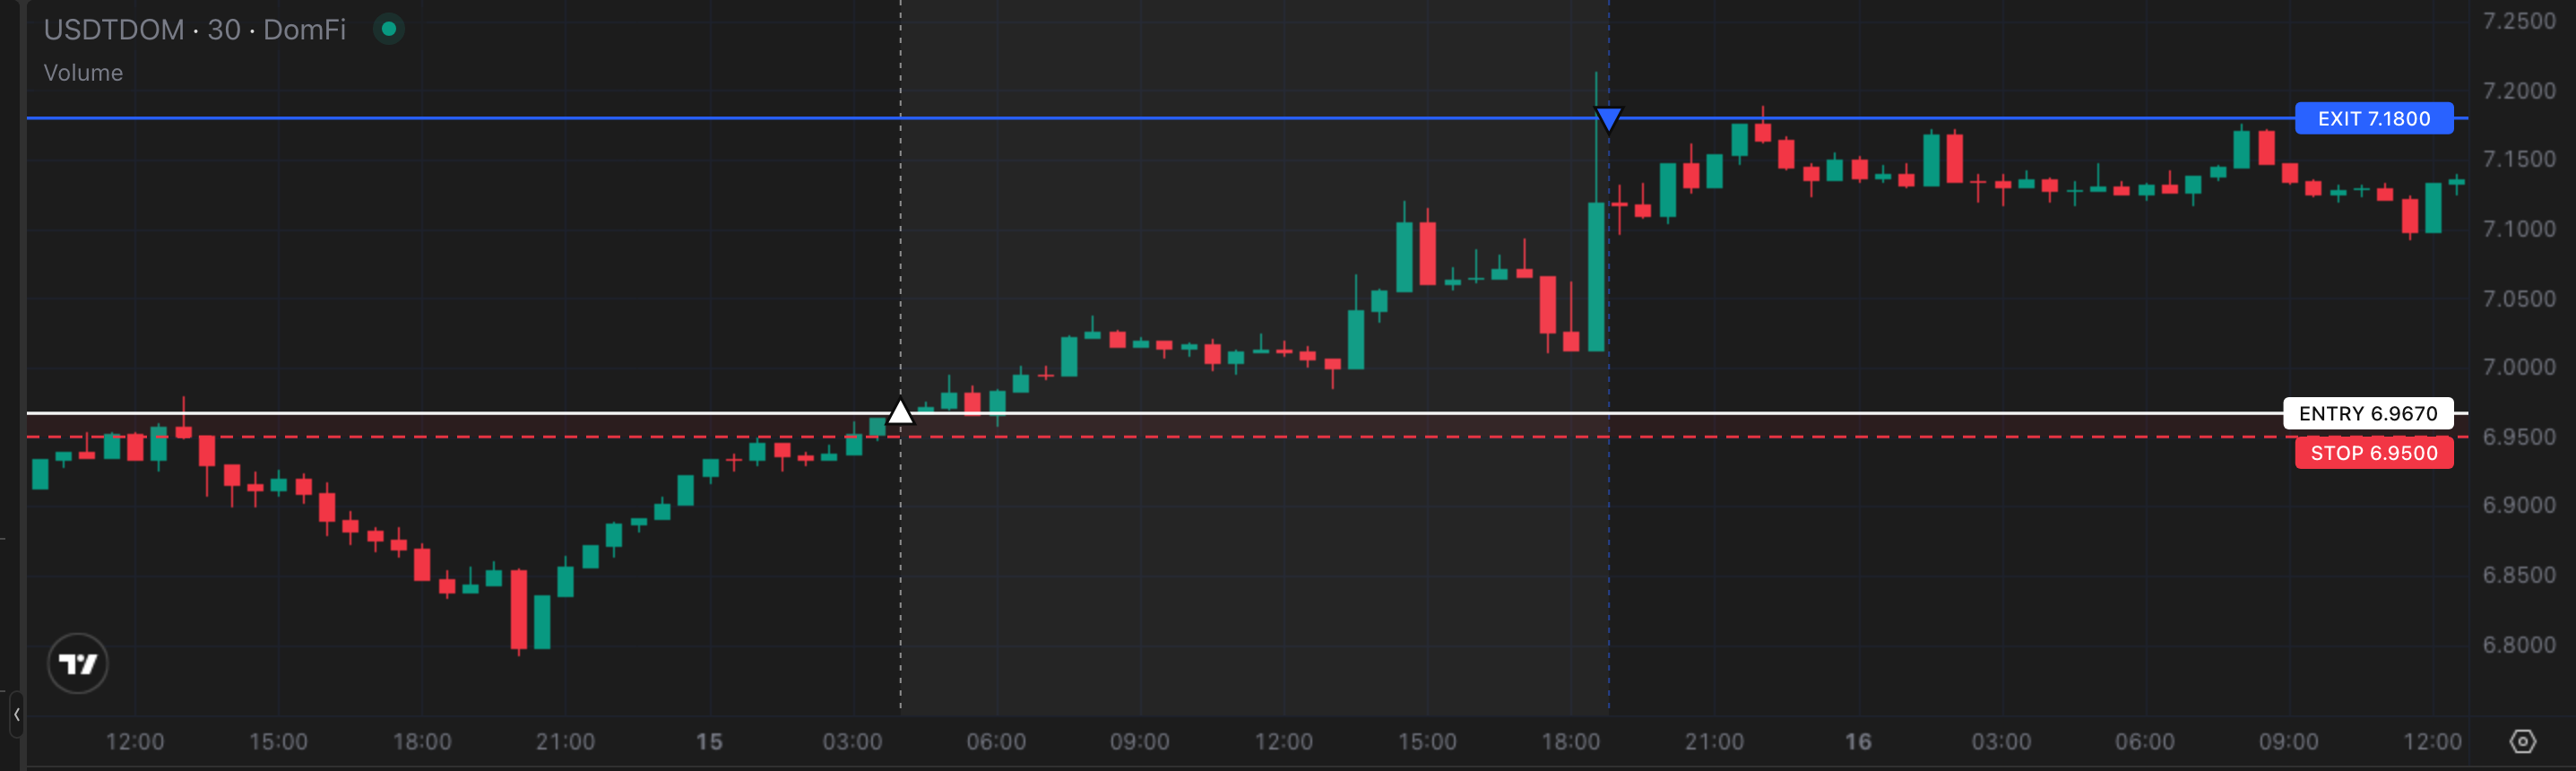
Entry: 6.9670 · Exit: 7.1800 · 100x · +305.8%
The Setup:
USDTDOM opened at 6.9436 and fell to 6.7447 in the 14:00 UTC hour on Friday 11 September, its low. It worked back up over the weekend. The hourly candle closed back through 6.94 at 04:00 UTC on Tuesday 15 September, and the long was market opened after that close, at 6.9670. There was no level left in front of the move for a limit to rest at, which is why it was taken at market.
Trade Management:
Stop-loss set at 6.95, the prior week’s close. USDTDOM was still at 6.95 on 10 September, the day the window opened, with two highs and one low printed either side of it. Back under it, the reclaim of 6.94 has failed and the drift back toward Friday’s low resumes. Distance 0.2435% below entry, which is 24.35% of collateral at 100x. Worst drawdown 0.132% from entry at 06:05 UTC, a little over half the room to the stop. Liquidation sits at 6.9043.
The Exit:
Take-profit rested at 7.18. It has rejected USDTDOM twice, the more recent one on 23 August, and it filled at 18:48 UTC the same day. 13R off the stop.
What It Paid:
A 0.2435% stop is what carries 100x here. Move +3.06%. Net +305.8%. A stop-out would have cost 24.35% of collateral. 13R. Held 14h 48m.
Takeaway:
The tight stop is the whole reason 100x fit here, and the size is the whole reason a 3.06% move paid 305.8%.
Trade USDTDOM: https://app.domination.finance/USDTDOM
2. BNB Dominance (BNBDOM) — Long, Closed
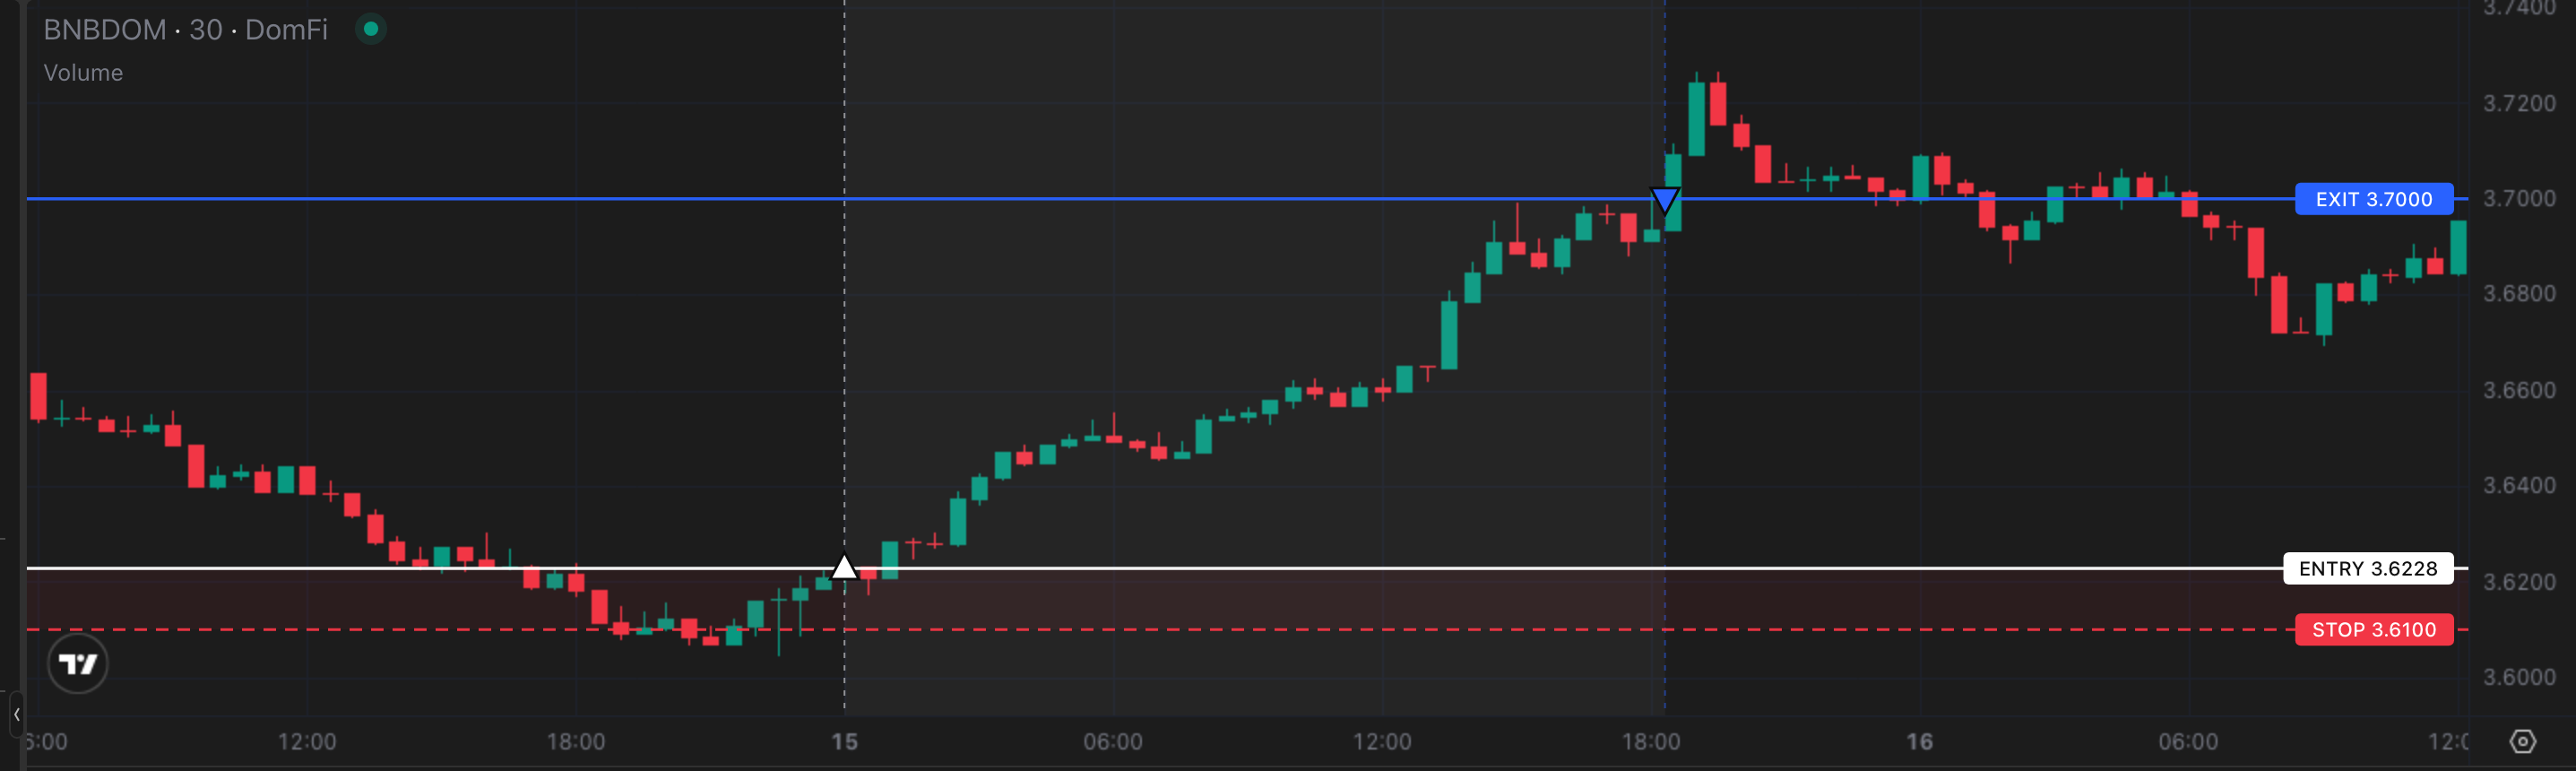
Entry: 3.6228 · Exit: 3.7000 · 75x · +159.8%
The Setup:
BNBDOM opened at 3.615 and made its low at 3.5997 three hours later, on Thursday 10 September. It spent four days working back. The hourly candle closed back through that open at 00:00 UTC on Tuesday 15 September, and the long was market opened after that close, at 3.6228.
Trade Management:
Stop-loss set at 3.61. BNBDOM has spent time on both sides of 3.61, two highs and two lows, and was still working through it on 10 September. Below it, BNBDOM is back under the open it just reclaimed, and that reclaim means nothing. Distance 0.3531% below entry, 26.48% of collateral at 75x. Worst drawdown 0.151% from entry at 00:36 UTC, 36 minutes into the hold, less than half the way to the stop. Liquidation sits at 3.5781.
The Exit:
Take-profit rested at 3.70. It has rejected BNBDOM twice, most recently on 9 September, six days before this entry. It filled at 18:19 UTC the same day. 6R off the stop.
What It Paid:
75x sits behind a 0.3531% stop. Move +2.13%. Net +159.8%. A stop-out would have cost 26.48% of collateral. 6R. Held 18h 19m.
Takeaway:
The reclaim of that open was the whole signal here: one confirmed candle back above 3.615 was reason enough to size the long into it.
Trade BNBDOM: https://app.domination.finance/BNBDOM
3. Ethereum Dominance (ETHDOM) — Short, Closed
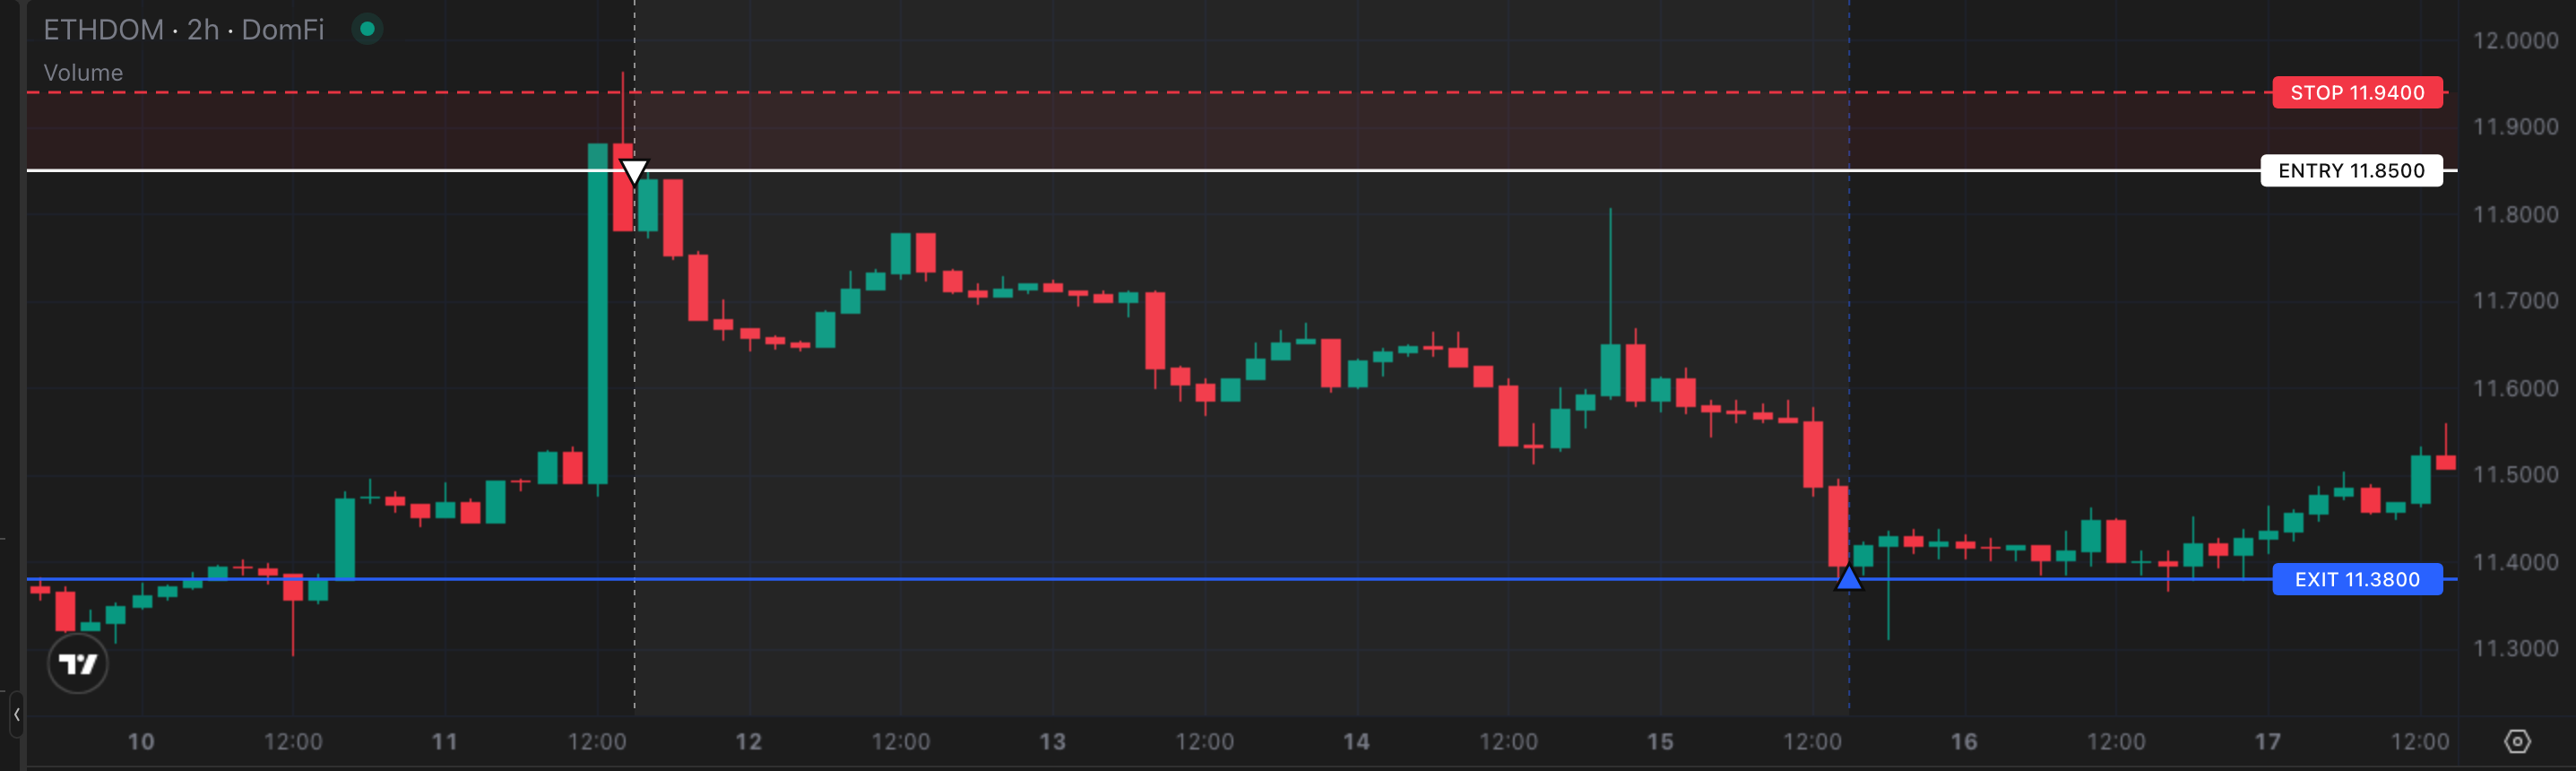
Entry: 11.8500 · Exit: 11.3800 · 35x · +138.8%
The Setup:
On Friday 11 September, liquidations of bearish ETH positions drove a brief rally across most digital assets, and ETHDOM ran to 11.964 in the 14:00 UTC hour. 11.87 sits just under that high, last in play on 23 January. The next hourly candle closed back below 11.87, and the short was market opened after that close, at 11.8500. A squeeze that gives the level straight back is the setup.
Trade Management:
Stop-loss set at 11.94. ETHDOM has not been near 11.94 since 29 January, though it printed on both sides of it before, one high and one low. Above 11.94, the failed break is itself undone and the spike is real. Distance 0.7591% above entry, 26.57% of collateral at 35x. This is the trade that ran hottest against its stop: 0.481% offside at 15:20 UTC, 20 minutes after the fill, about two thirds of the way to the stop. Liquidation sits at 12.1768.
The Exit:
Take-profit rested at 11.38, ETHDOM’s own opening price. It has traded both sides of it, three highs against one low, and was sitting at it again on 10 September. A short taken at the high aiming back at the open is asking for a round trip and nothing more. It filled at 14:57 UTC on Tuesday 15 September. 5R off the stop.
What It Paid:
35x behind a 0.7591% stop. Move +3.97%, the largest underlying move here. Net +138.8%. A stop-out would have cost 26.57% of collateral. 5R. Held 4d.
Takeaway:
A level that gives itself straight back inside an hour is a short worth sizing into, not just one worth watching.
Trade ETHDOM: https://app.domination.finance/ETHDOM
4. Solana Dominance (SOLDOM) — Long, Closed
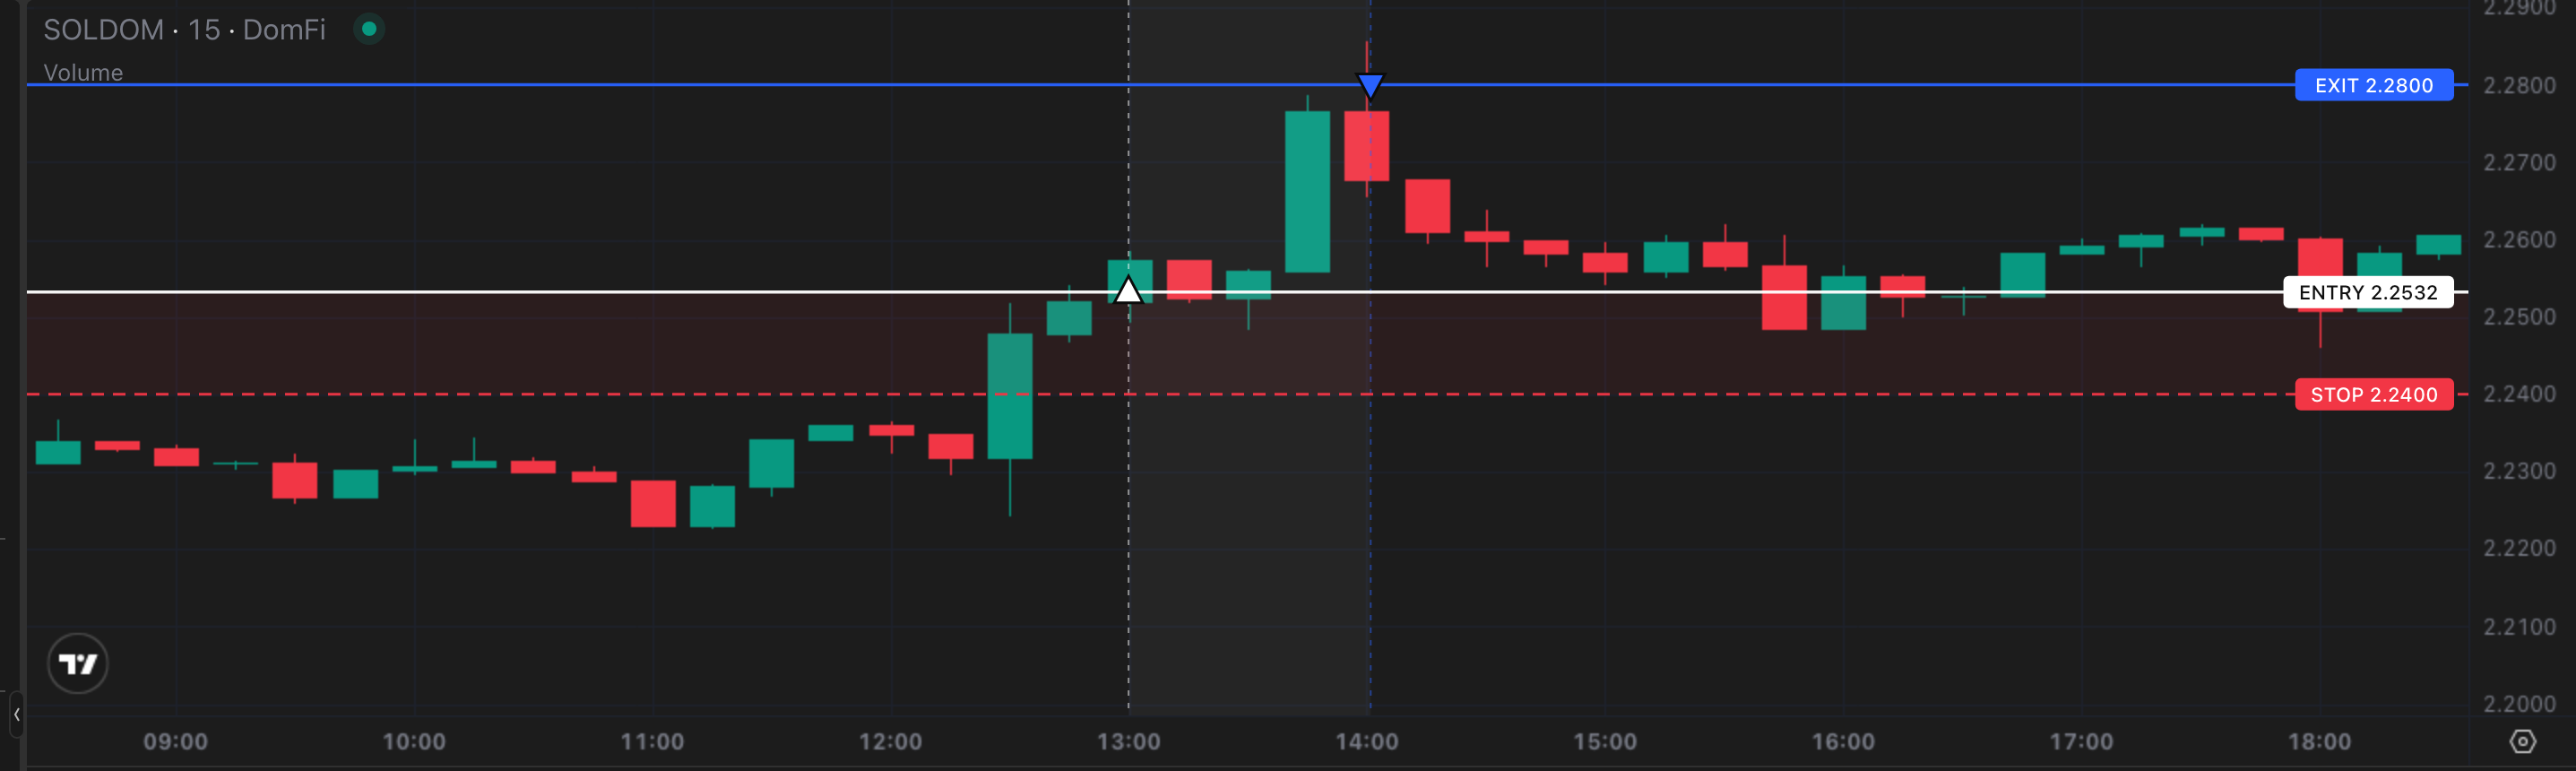
Entry: 2.2532 · Exit: 2.2800 · 40x · +47.6%
The Setup:
The fastest trade of the set, and it ran on the same Friday afternoon as the ETHDOM spike. SOLDOM pushed through 2.25, its opening print from 10 September, and the hourly candle closed above it at 13:00 UTC, so the long was market opened after that close, at 2.2532.
Trade Management:
Stop-loss set at 2.24, the prior week’s close. That price has held SOLDOM before and was last touched on 10 September. Back under it, the push through 2.25 has failed. Distance 0.5862% below entry, 23.45% of collateral at 40x. Worst drawdown 0.217% from entry at 13:37 UTC, 37 minutes in, well clear of the stop. Liquidation sits at 2.1991.
The Exit:
Take-profit rested at 2.28. It has rejected SOLDOM twice, the latest on 9 September, and it filled at 14:01 UTC, an hour and a minute after entry. 2R off the stop.
What It Paid:
40x behind a 0.5862% stop. Move +1.19%. Net +47.6%. A stop-out would have cost 23.45% of collateral. 2R. Held 1h 1m.
Takeaway:
The smallest underlying move here needs no apology: a 0.5862% stop is what carried 40x, and the whole trade was over inside an hour.
Trade SOLDOM: https://app.domination.finance/SOLDOM
5. Bitcoin Dominance (BTCDOM) — Short, Closed
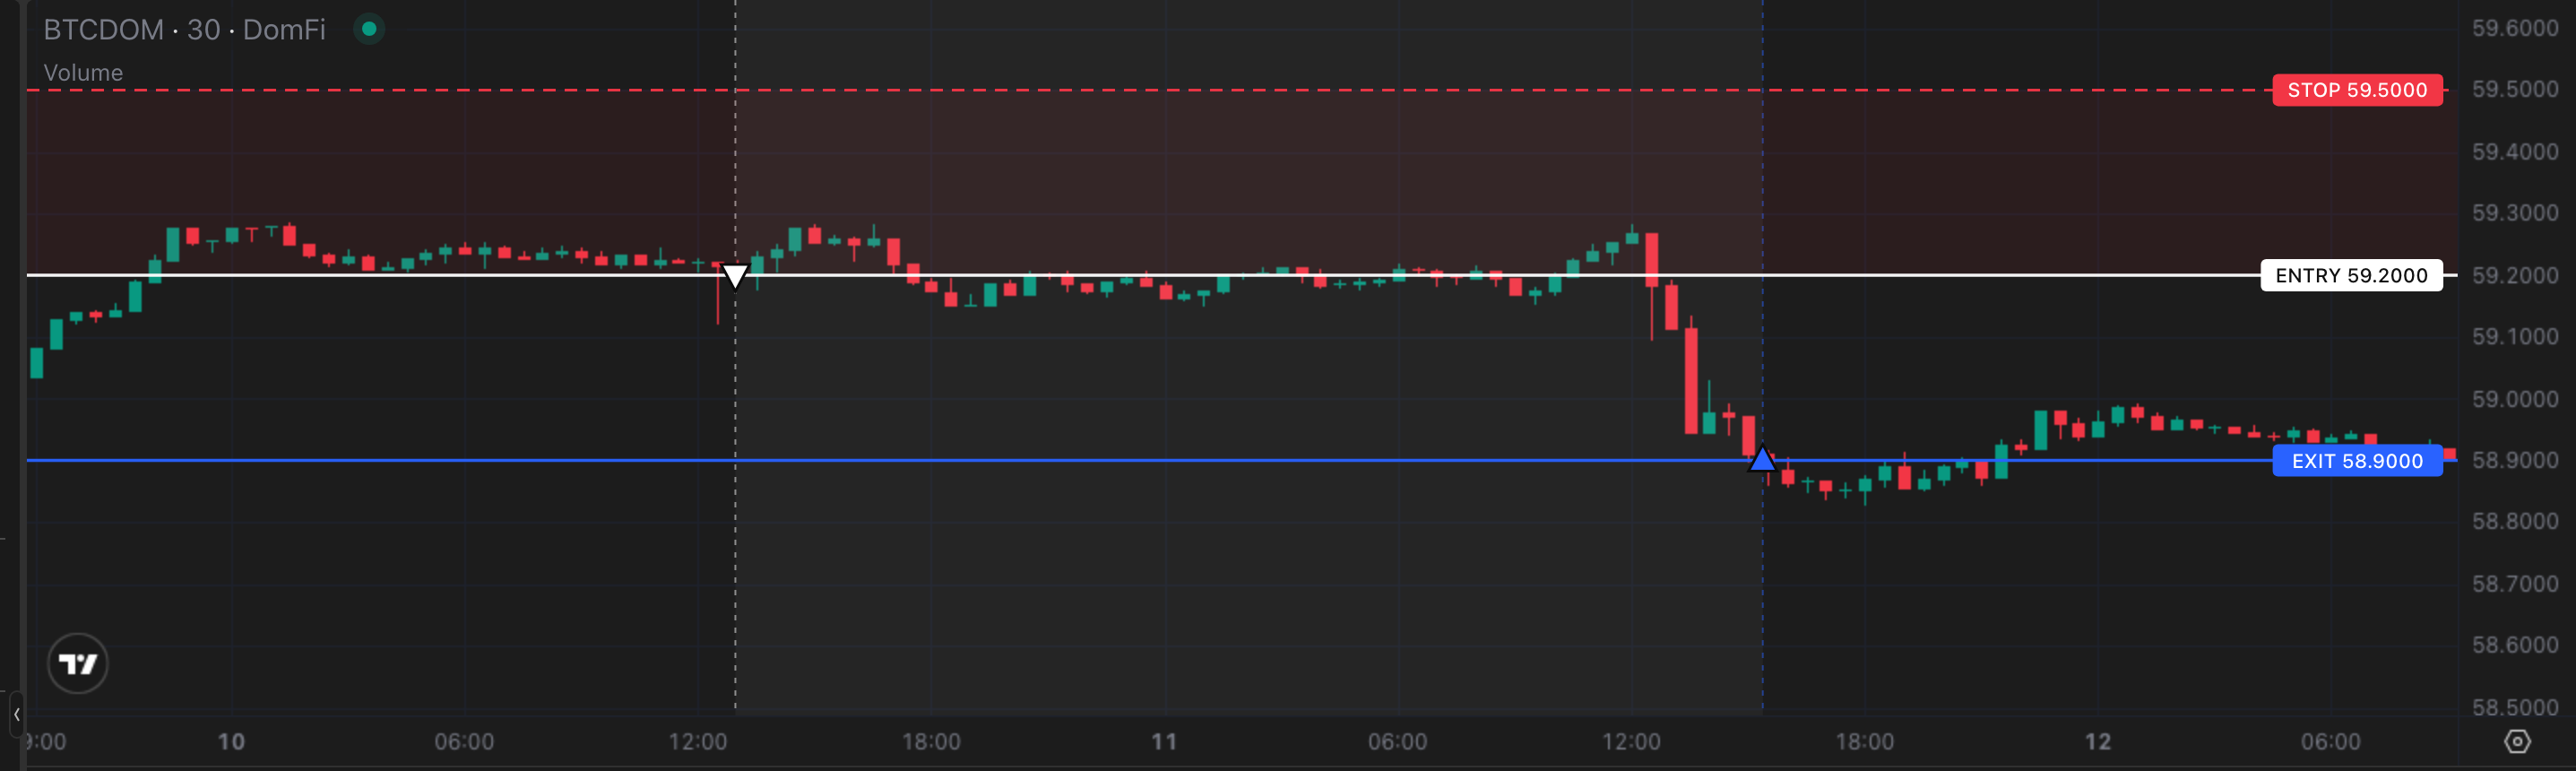
Entry: 59.2000 · Exit: 58.9000 · 45x · +22.8%
The Setup:
The only limit entry of the set. 59.20 is long-standing structure on the daily series: BTCDOM has traded both sides of it, one high against three lows, and was working the level again on 9 September, the day before the window opened. That made it a known price rather than one to chase, and the limit short was left there and filled at 12:58 UTC on Thursday 10 September, 58 minutes after the window opened.
Trade Management:
Stop-loss set at 59.50, a round number. It has rejected BTCDOM three times and last traded on 7 September, which is the structure behind it. Above it, the short has nothing left overhead to lean on. Distance 0.5068% above entry, 22.81% of collateral at 45x. Worst drawdown 0.142% from entry at 12:26 UTC on 11 September, a little over a quarter of the way to the stop, the most room any trade here kept. Liquidation sits at 60.4860.
The Exit:
Take-profit rested at 58.90. BTCDOM has traded both sides of it, one high against three lows, and was at it again on 22 August. It filled at 15:23 UTC on Friday 11 September, the same afternoon that took ETHDOM to its high. 1R off the stop.
What It Paid:
45x behind a 0.5068% stop. Move +0.51%. Net +22.8%. A stop-out would have cost 22.81% of collateral. 1R. Held 1d 2h.
Takeaway:
A price the market was sitting on one day earlier does not need a fresh signal to be worth resting an order at.
Trade BTCDOM: https://app.domination.finance/BTCDOM
- Trade on DomFi: https://app.domination.finance/
- Deposit USDC into the Vault: https://app.domination.finance/vault
- Make a Referral Code: https://app.domination.finance/referrals
- Join our Discord: https://discord.com/invite/6wG5cdNSbM
Retrospective and illustrative only. Every trade shown here was selected after the fact, with full knowledge of how the week resolved. These are hypothetical results chosen in hindsight to illustrate the range of setups that dominance pairs produce in a single week. They are not a track record, not a representation of actual trading, and not a representation that any account did or would achieve these results.
Entries and exits are drawn from prices that printed during the stated window, but no fill is guaranteed to have been obtainable at any particular size, and the figures exclude trading fees, funding, slippage and price impact. Returns are expressed as a percentage of collateral at the stated leverage; leveraged positions carry a risk of total loss, and a position can be liquidated by an adverse move well short of the levels shown.
Nothing here is financial, investment, or trading advice. Past performance does not indicate future results. Always conduct your own research.