Trades of the Week #1
Five trades from the week of 27 July to 2 August, marked against each dominance market's own price action. All catalogued after the close; none was called live.
DOMINANCE TRADES OF THE WEEK
July 27 – August 2, 2026
Edition #1
Five trades from the week of 27 July to 2 August, marked against each dominance market’s own price action. All catalogued after the close; none was called live.
| Pair | Direction | Leverage | Entry | Exit | Net Return | Hold |
|---|---|---|---|---|---|---|
| ETHDOM | Short | 105x | 10.6161 | Still open | Open | |
| BNBDOM | Long | 40x | 3.4737 | 3.6500 | +203.0% | 2d 20h |
| USDTDOM | Long | 10x | 8.2688 | 8.5000 | +28.0% | 19h 49m |
| BTCDOM | Short | 40x | 59.0728 | 58.7299 | +23.2% | 5d |
| SOLDOM | Long | 80x | 1.9559 | 1.9679 | +49.0% | 6h 38m |
1. Ethereum Dominance (ETHDOM) — Short, Open
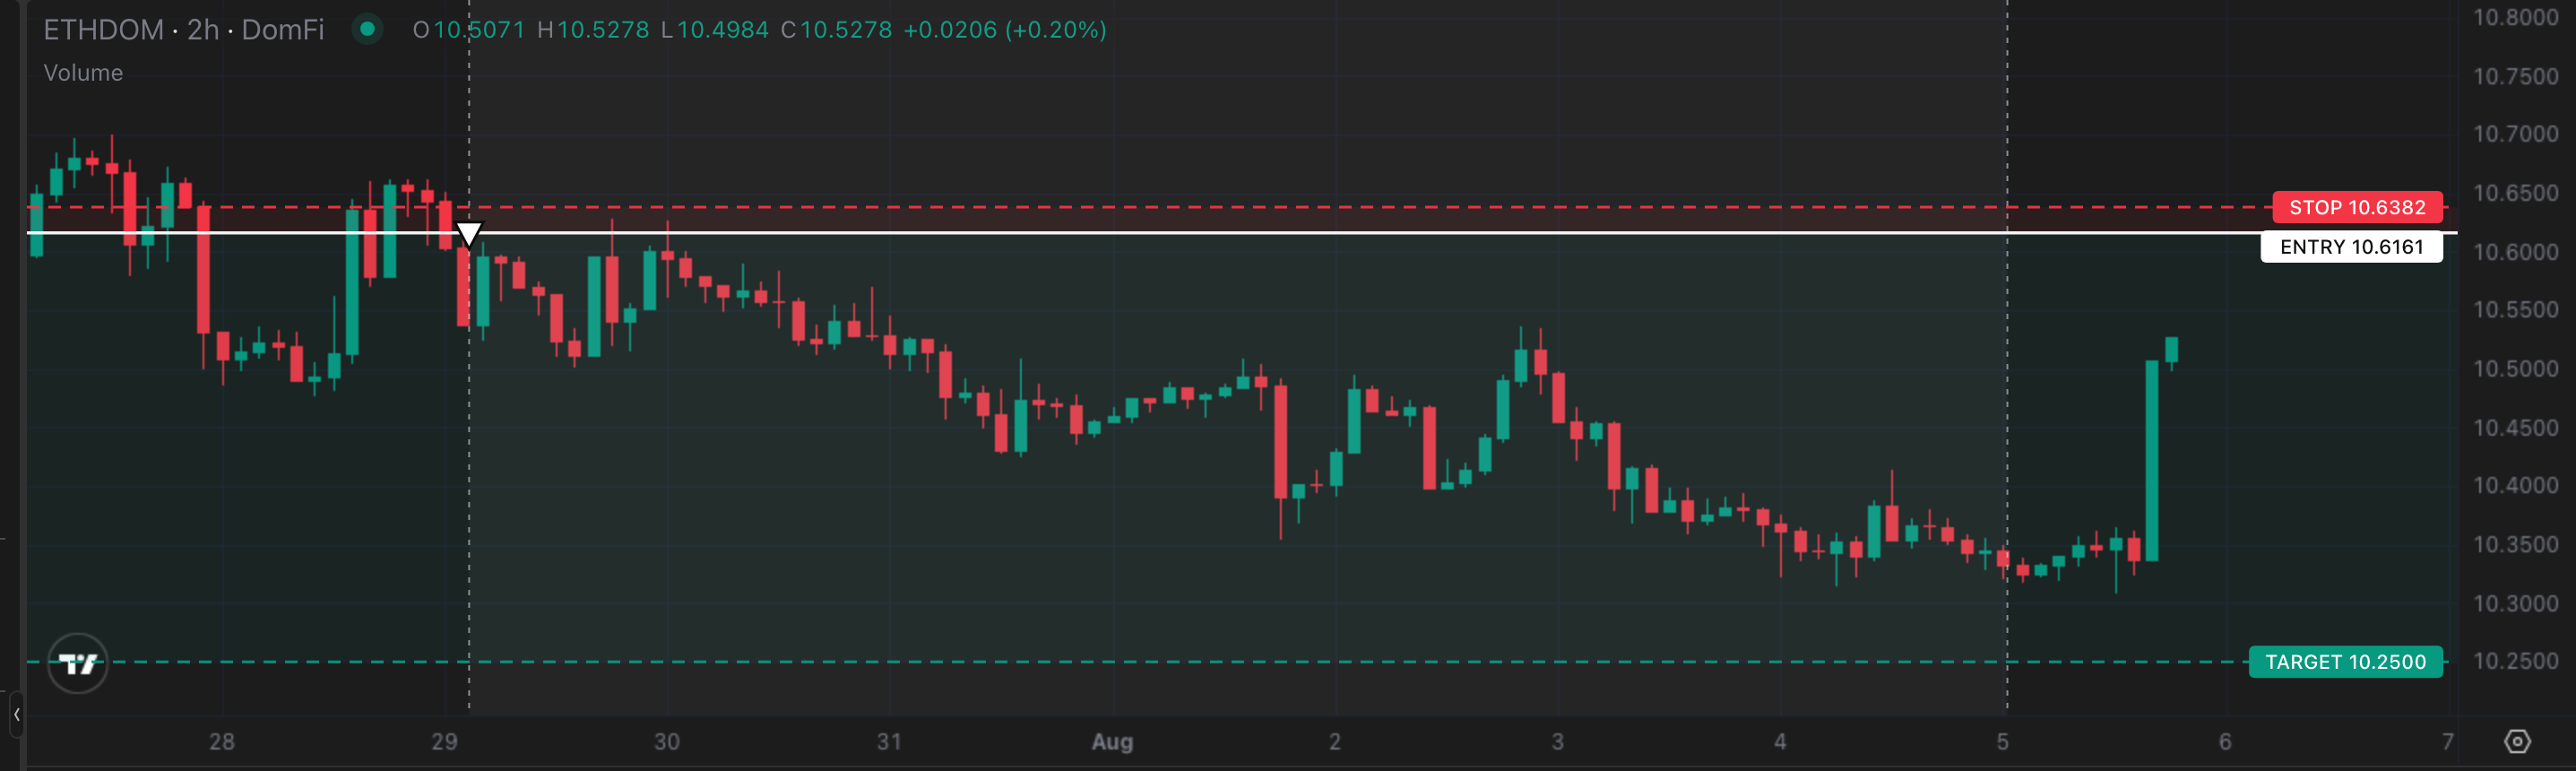
Entry: 10.6161 · Still open · 105x
The Setup:
ETHDOM tagged 10.70 on Monday, its highest reading in eight weeks, and failed there. That prior-week high came on a thin Sunday squeeze, not demand sustained across the week. The trigger was technical: ETHDOM lost the prior week’s close of 10.6169 on Wednesday 29 July at 02:40 UTC. The flow disagreed with the short. Spot Ethereum ETFs took in $27.42M that week, a fourth straight week of inflows, so ETH was being bought for the whole time this position was open. ETHDOM still fell. ETH is the numerator here; the denominator is the rest of the market, and it was being bought harder.
Trade Management:
Stop-loss set at 10.6382, the prior week’s high. 0.208% above entry. At 105x that is 21.84% of margin. Worst drawdown was 0.117% from entry, about 56% of the way to the stop. Liquidation sits at 10.7066, 0.852% above entry.
Still Open Rationale:
Structure is intact. Price has not traded back through 10.6161. The take-profit rests at 10.25, the top of the range ETHDOM spent most of the past eight weeks under. The stop has been brought down to breakeven at 10.6161, so the worst case on the position is now flat rather than the 21.84% of margin the original invalidation at 10.6382 would have cost.
Takeaway:
A short can be correct on structure while the flow underneath disagrees with it; know which one the position is actually leaning on.
2. BNB Dominance (BNBDOM) — Long, Closed
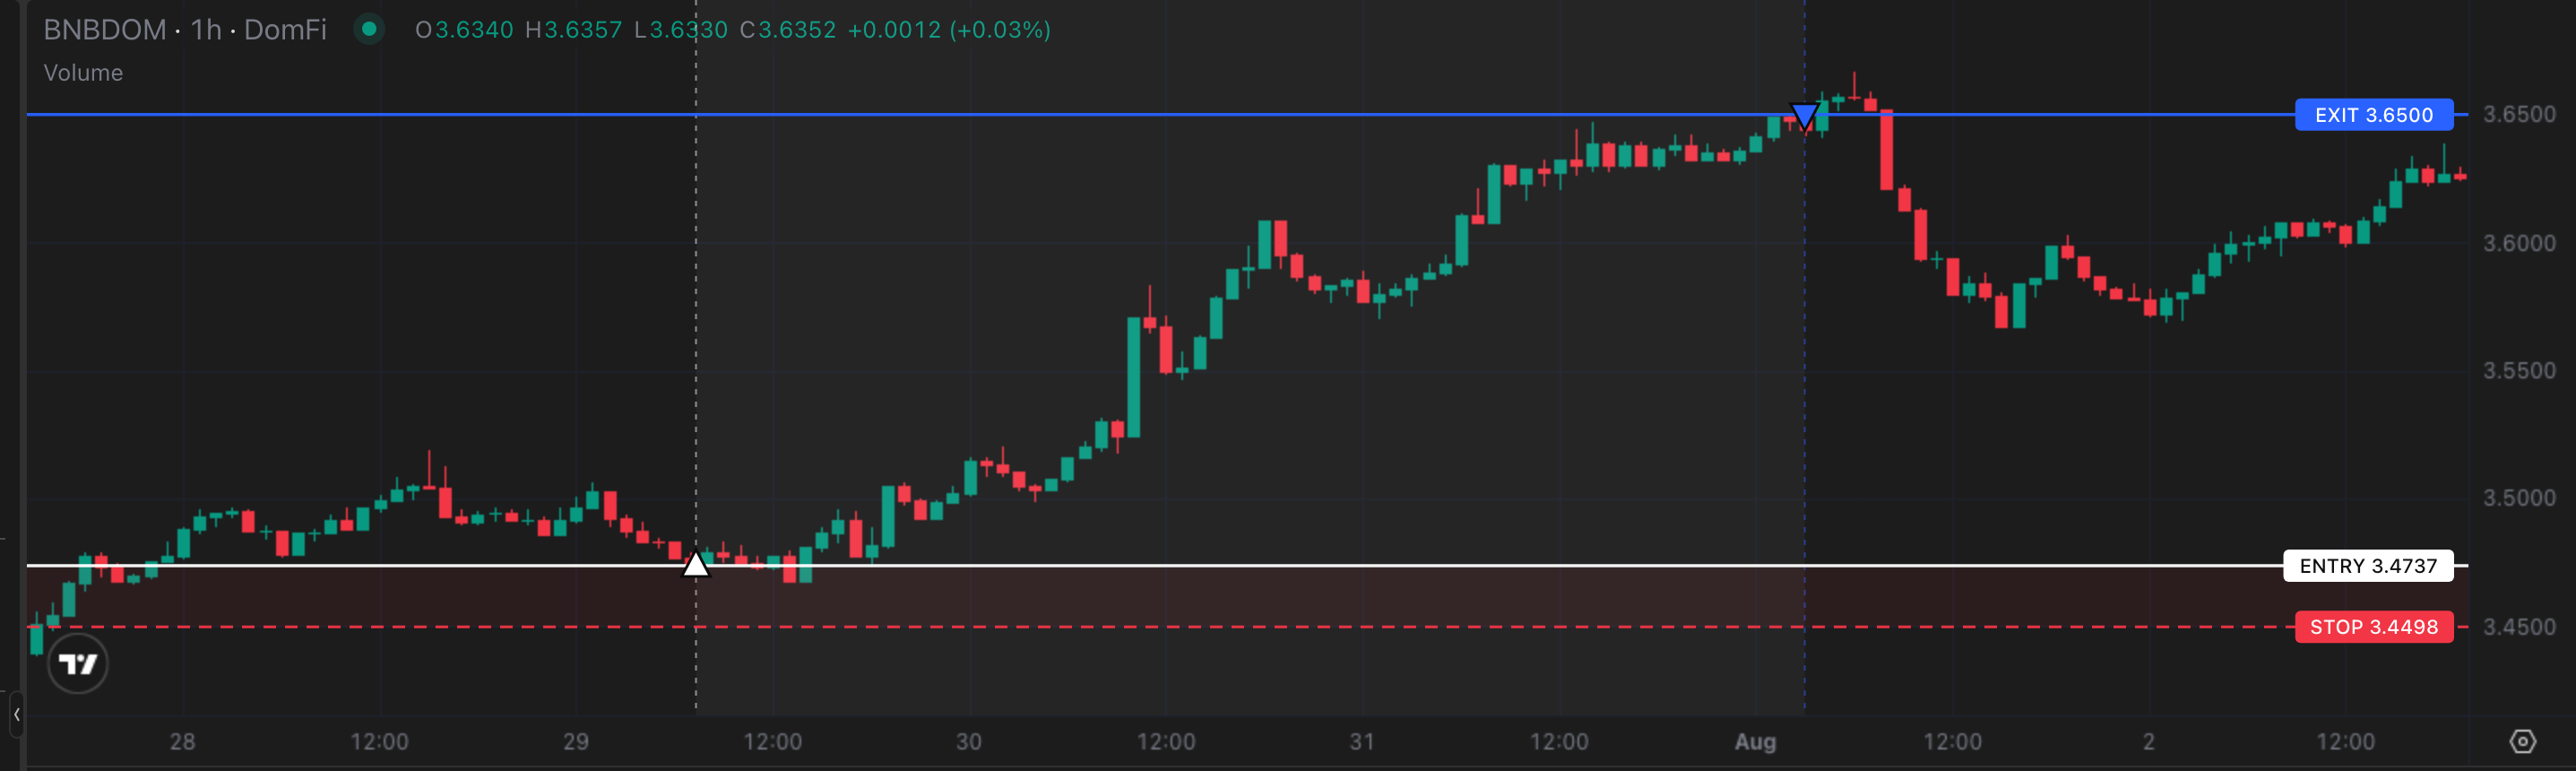
Entry: 3.4737 · Exit: 3.6500 · 40x · +203.0%
The Setup:
BNBDOM printed higher lows through July: 3.38 on the 22nd, 3.41 on the 24th, 3.43 at Monday’s open. On Wednesday 29 July at 07:20 UTC it reclaimed the prior week’s high of 3.4797. That was the trigger. BNB Chain led every Layer-1 in weekly DEX volume at $19B, ahead of Solana’s $10.6B and Ethereum’s $5.8B, and BNB broke a 45-day descending trendline the same week. BNB is the numerator in BNBDOM; BNB rallied while the rest of the market, the denominator, stalled, and BNBDOM rose with it.
Trade Management:
Stop-loss set at 3.4498, Monday’s open. 0.689% below entry. At 40x that is 27.55% of margin. Worst drawdown was 0.179% from entry, about a quarter of the way to the stop. Liquidation sits at 3.3904, 2.40% below entry.
The Exit:
Take-profit set at 3.65 on entry. BNBDOM held above 3.65 for most of June, peaking at 3.9852, then lost the level in early July and last tagged it on the 5th. Three weeks later it was back for the first retest, which is where the order belonged. It filled at 03:00 UTC on Saturday 1 August.
What It Paid:
Move +5.07%. +203.0% at 40x. A stop-out would cost 27.55% of margin. 7.4R. Held 2d 20h.
Takeaway:
Nothing to decide on this one. 3.65 held BNBDOM up through June and capped it after the early-July break, so the take-profit sat there from entry and filled itself just under three days later.
3. Tether Dominance (USDTDOM) — Long, Closed
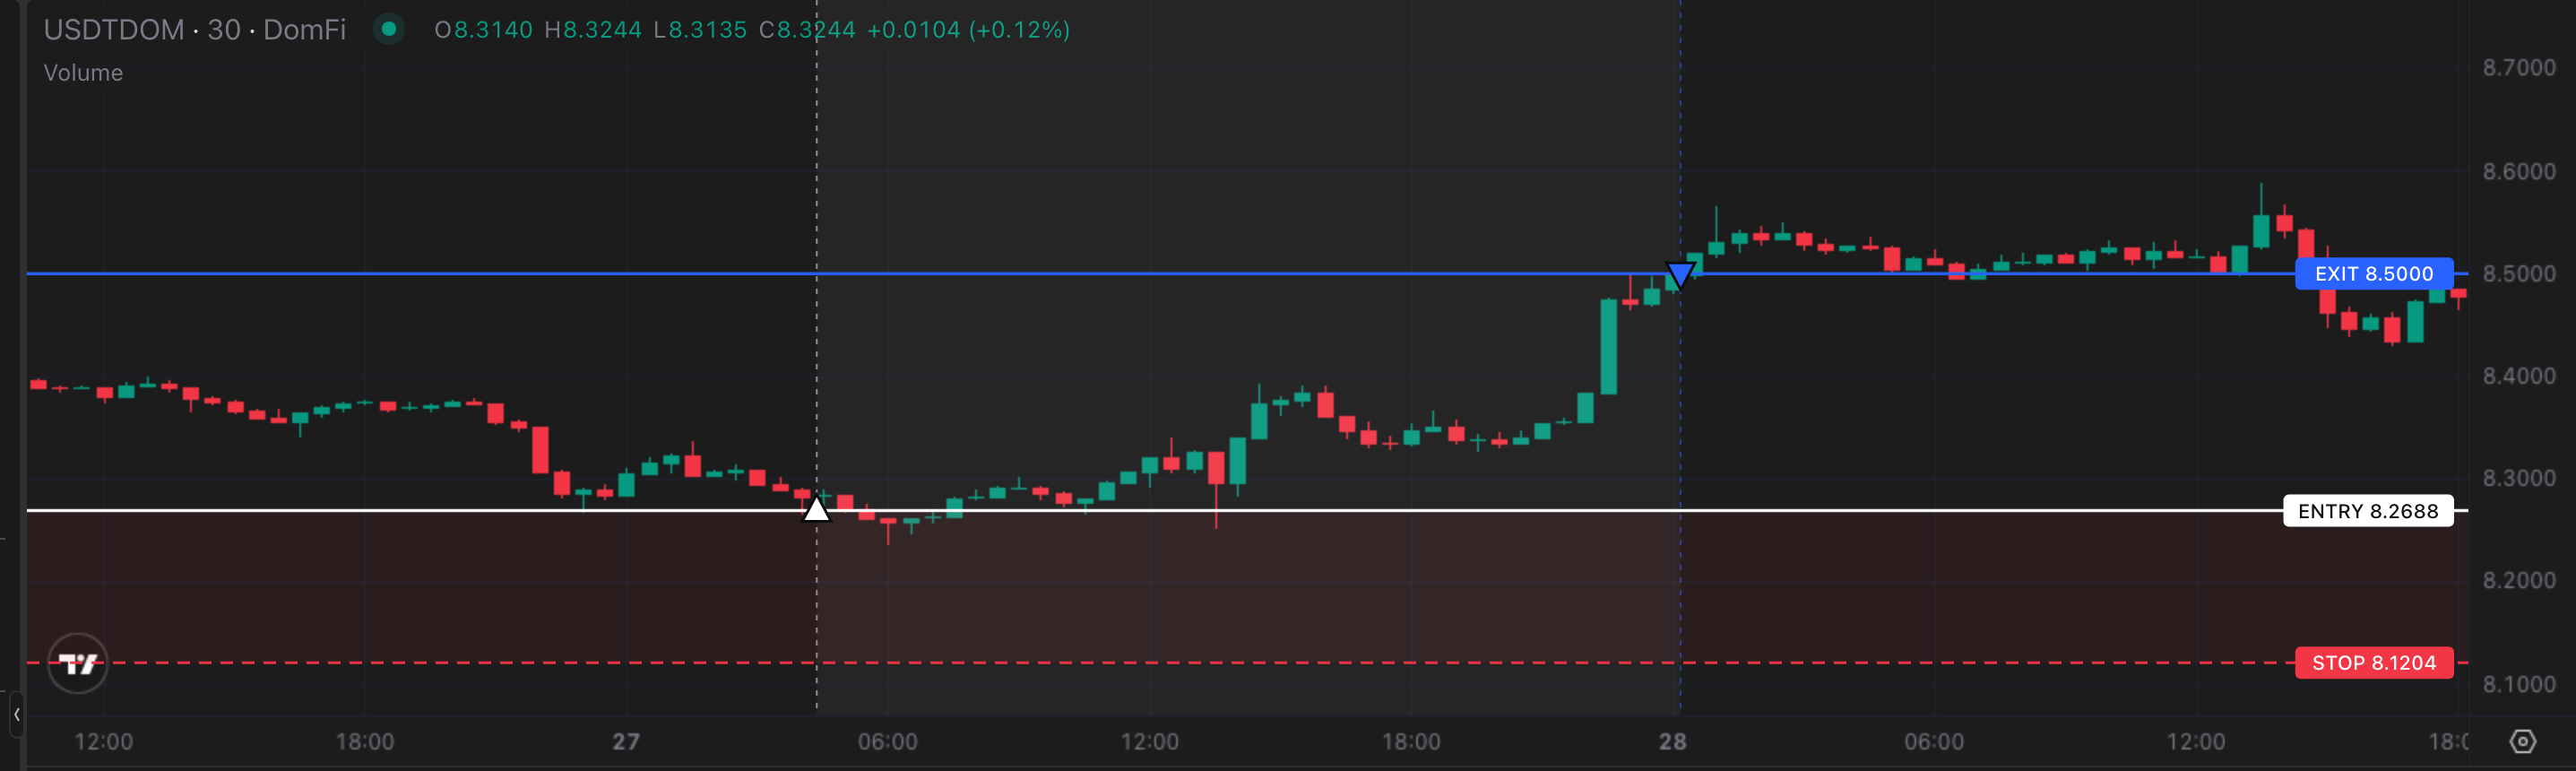
Entry: 8.2688 · Exit: 8.5000 · 10x · +28.0%
The Setup:
The trigger was a date, not a level: the FOMC decision on 29 July, with roughly a one-in-three market-implied chance of a hike going in. Defensive positioning into a scheduled binary, taken Monday 27 July at 04:22 UTC. Entry also sat at the prior week’s close of 8.2835. Tether’s own supply doesn’t move around an FOMC decision; a rise in USDTDOM here would come from the rest of the market, the denominator, contracting into the print rather than from Tether itself.
Trade Management:
Stop-loss set at 8.1204, the prior week’s low. 1.795% below entry, the widest stop of the week. At 10x that is 17.95% of margin. That width is why this is the smallest size on the board. Worst drawdown was 0.397% from entry, about a fifth of the way to the stop. Liquidation sits at 7.4502, 9.90% below entry.
The Exit:
8.50 was the take-profit, set on entry, and it was a round number rather than a level: USDTDOM had been trading either side of it since early June and last tagged it on 17 July, so there was nothing structural to lean on. For a defensive position that was enough. The order filled at 00:11 UTC on Tuesday 28 July, more than a day before the decision the trade had been opened for.
What It Paid:
Move +2.80%. +28.0% at 10x. A stop-out would cost 17.95% of margin. 1.56R. Held 19h 49m.
Takeaway:
The take-profit was set for tidiness, not for the thesis, and it closed the trade more than a day before the event it was opened for. Worth knowing which of the two an order is serving.
4. Bitcoin Dominance (BTCDOM) — Short, Closed
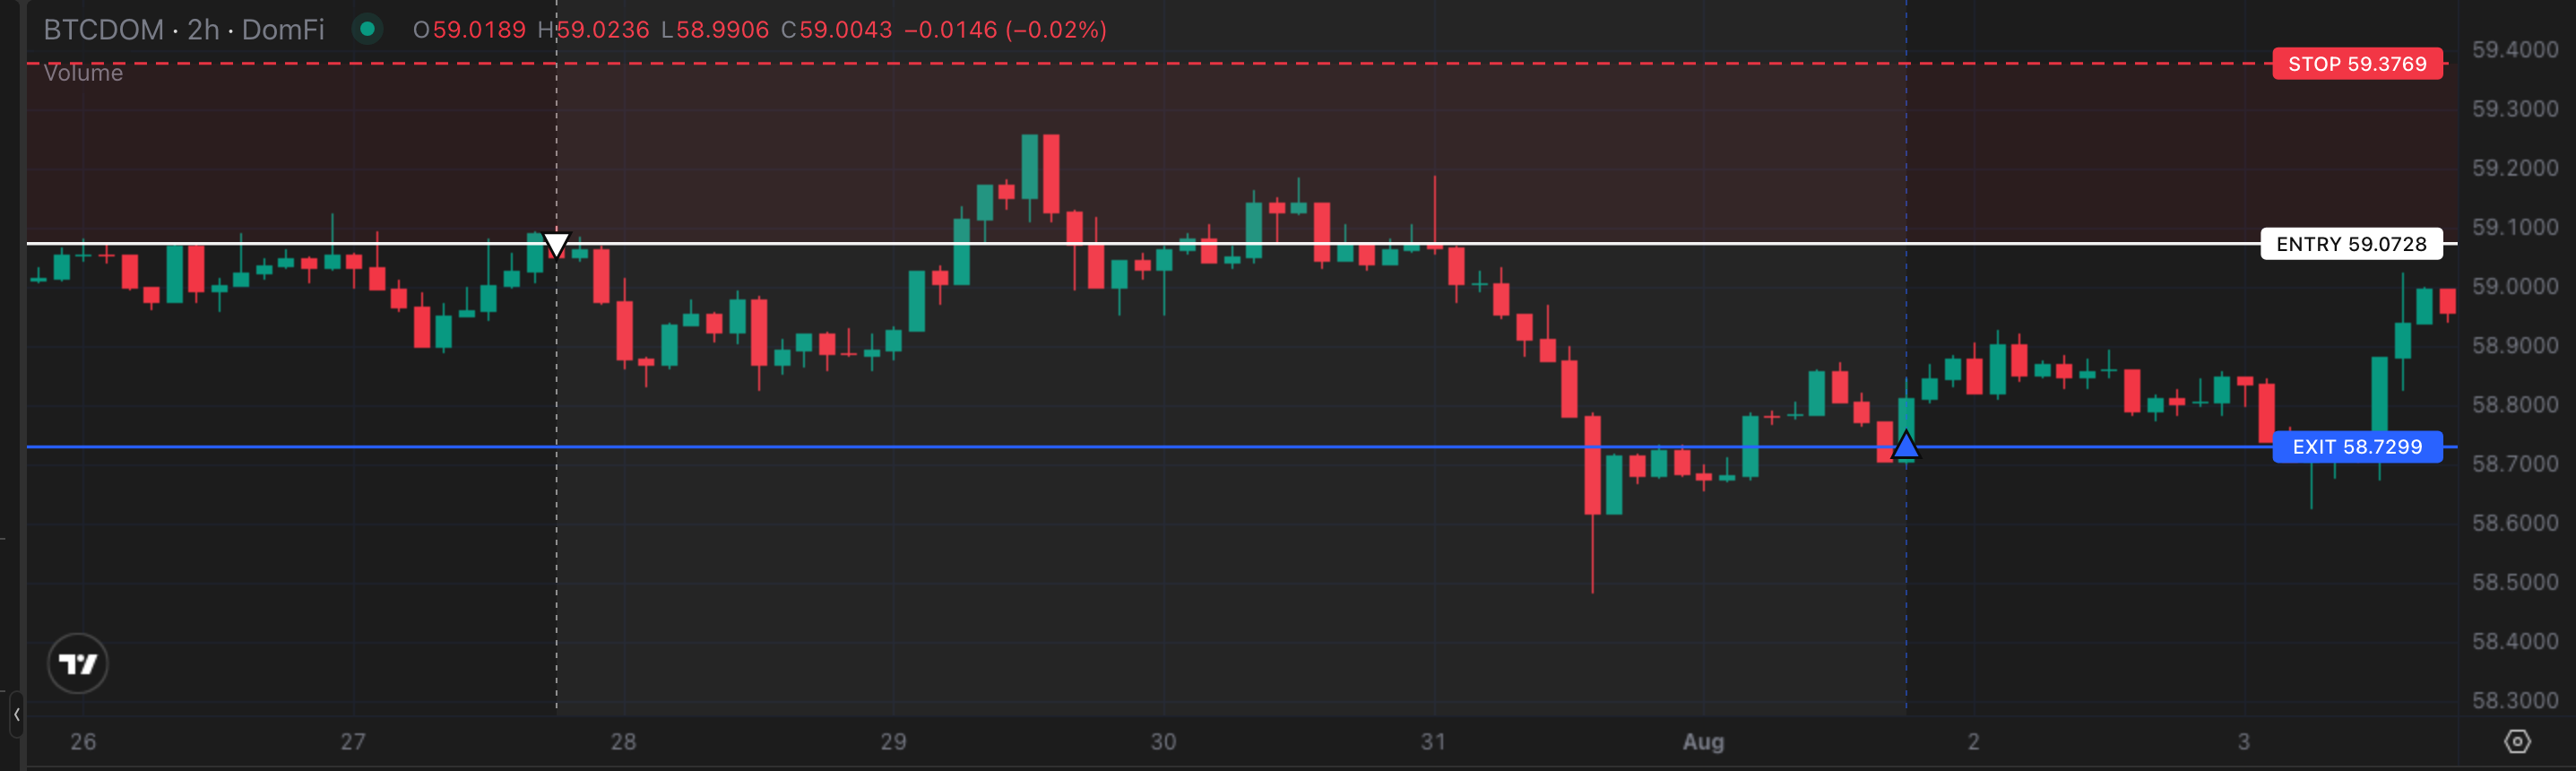
Entry: 59.0728 · Exit: 58.7299 · 40x · +23.2%
The Setup:
Purely technical. Short into the confluence of the week’s open at 59.0563 and the prior week’s close at 59.0533, taken Monday 27 July at 18:04 UTC. BTCDOM’s whole weekly range was 1.33%, the tightest on the board.
Trade Management:
Stop-loss set at 59.3769, the prior week’s high. 0.515% above entry. At 40x that is 20.59% of margin. Worst drawdown was 0.313% from entry, about 61% of the way to the stop, the closest any trade here came to being stopped out. Liquidation sits at 60.5201, 2.45% above entry.
The Exit:
No take-profit was set. The prior week’s low at 58.8752 was the level being watched, and BTCDOM went through it without stalling. What closed the position was the tape on Saturday 1 August: by 18:01 UTC, SOLDOM had lost 0.850% in the hour and USDTDOM was bid 0.382% higher, with capital moving toward cash across the board. A broad risk-off is where a short on Bitcoin Dominance is most exposed, so it was market closed at 58.7299, banking five days of work rather than risking it into a bid for cash.
What It Paid:
Move +0.58%. +23.2% at 40x. A stop-out would cost 20.59% of margin. 1.13R, the weakest of the week. Held 5d.
Takeaway:
No catalyst, no story, just two prior-week markers lining up. The confluence put the invalidation 0.515% away, and a stop that tight is what carried 40x into +23.2%.
5. Solana Dominance (SOLDOM) — Long, Closed
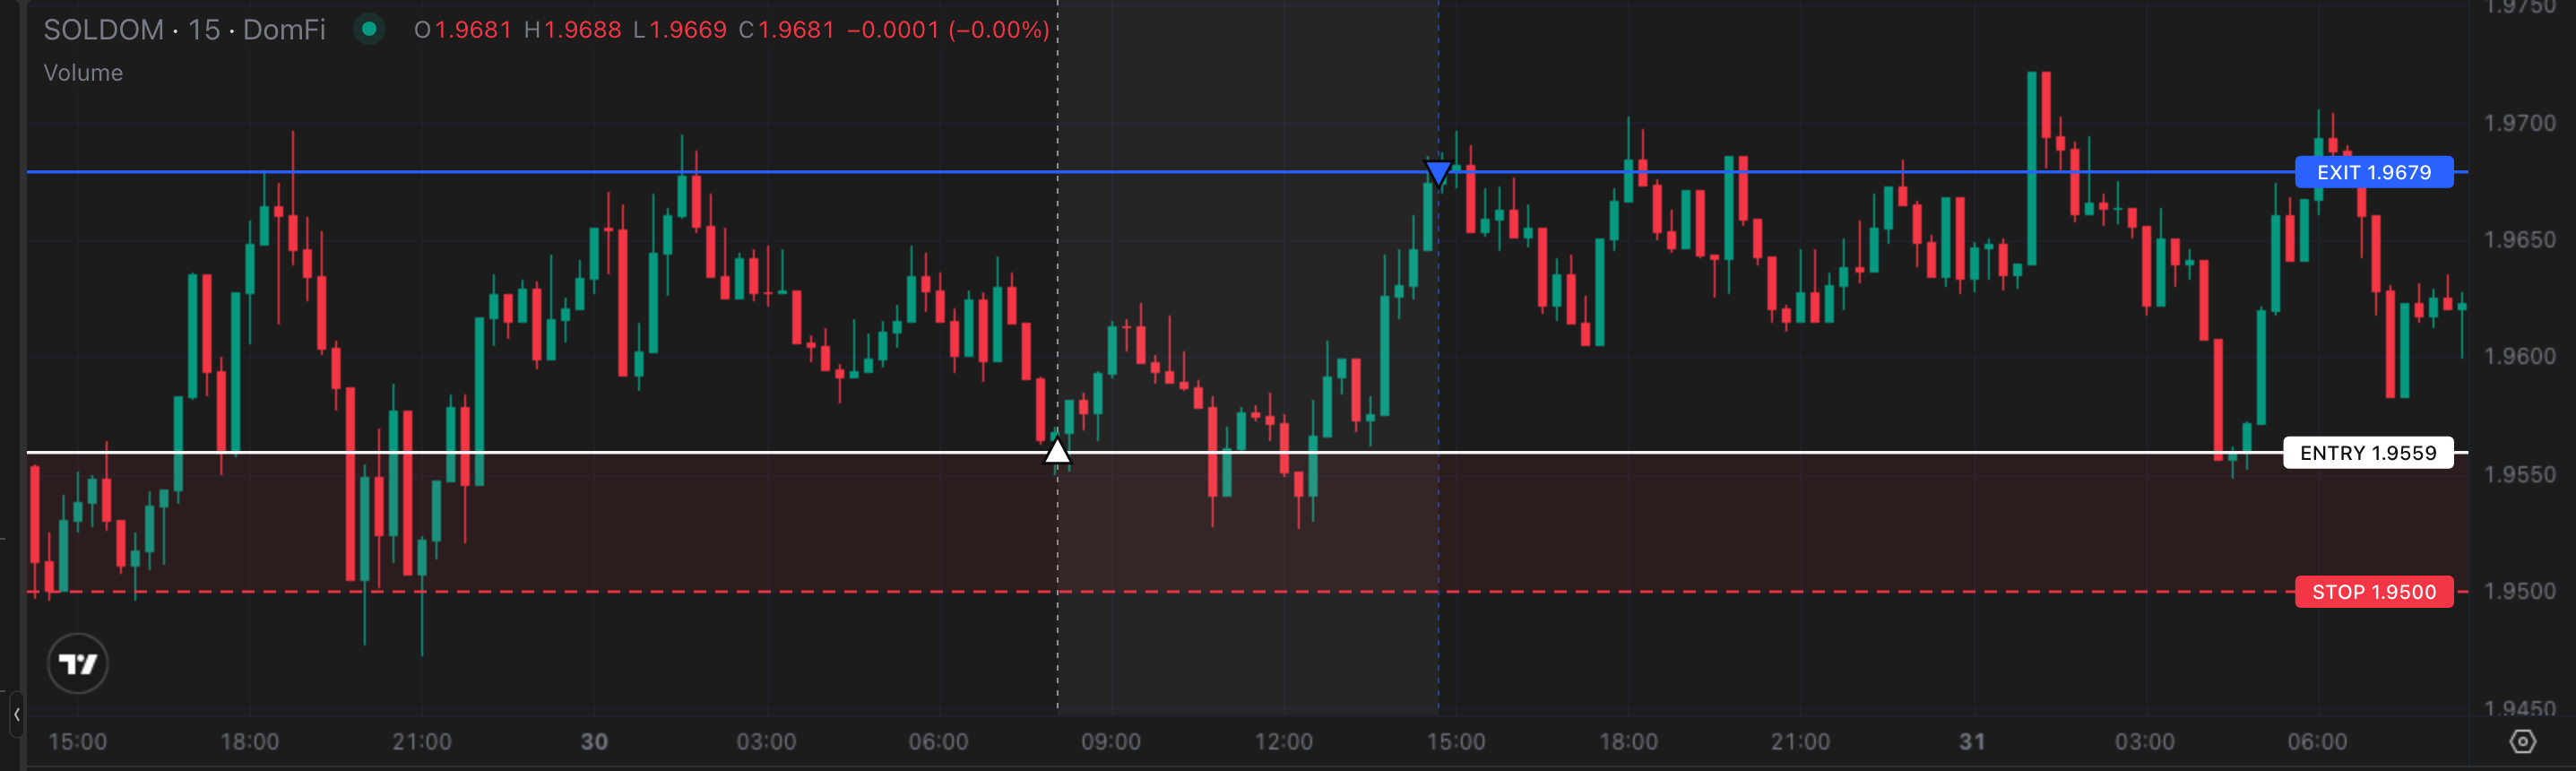
Entry: 1.9559 · Exit: 1.9679 · 80x · +49.0%
The Setup:
Purely technical. SOLDOM swept the prior week’s low of 1.9679, traded 0.608% below it, and failed to hold there. Sweep and reclaim, taken Thursday 30 July at 08:04 UTC.
Trade Management:
Stop-loss set at 1.95. 0.303% below entry. At 80x that is 24.26% of margin. That tight invalidation is what supports the 80x size. Worst drawdown was 0.168% from entry, about 55% of the way to the stop. Liquidation sits at 1.9334, 1.15% below entry.
The Exit:
The order sat at 1.9679, the low SOLDOM had just swept and reclaimed. A sweep is only confirmed when price recovers the level it took out, which makes that level the natural place to book the trade rather than the start of a new leg. It filled at 14:42 UTC on Thursday 30 July, six and a half hours after entry.
What It Paid:
Move +0.61%. +49.0% at 80x. 2.02R. Held 6h 38m. SOLDOM finished the week down 1.97%: over the full week the rest of the market outgrew SOL. Inside that week, for the six and a half hours this position was open, SOL gained ground on the rest of the market and SOLDOM rose. A losing week for SOLDOM and a losing trade inside it are not the same thing.
Takeaway:
The week is not the only window that matters; a market can lose ground over seven days and still hand out a win inside one of them.
Retrospective and illustrative only. Every trade shown here was selected after the fact, with full knowledge of how the week resolved. These are hypothetical results chosen in hindsight to illustrate the range of setups that dominance pairs produce in a single week. They are not a track record, not a representation of actual trading, and not a representation that any account did or would achieve these results.
Entries and exits are drawn from prices that printed during the stated window, but no fill is guaranteed to have been obtainable at any particular size, and the figures exclude trading fees, funding, slippage and price impact. Returns are expressed as a percentage of margin at the stated leverage; leveraged positions carry a risk of total loss, and a position can be liquidated by an adverse move well short of the levels shown.
Nothing here is financial, investment, or trading advice. Past performance does not indicate future results. Always conduct your own research.