Dominance Debrief #22
BTCDOM was the only pair on the board to fall this week. The market shrank 2.29% and every other reading held or gained. The selling was Bitcoin-specific: $385.2M left spot BTC ETFs against $3.0M out of Ether funds.
THE DOMINANCE DEBRIEF
Week of August 10 – August 16, 2026
Issue #22
TL;DR: BTCDOM was the only pair on the board to fall this week. The market shrank 2.29% and every other reading held or gained. The selling was Bitcoin-specific: $385.2M left spot BTC ETFs against $3.0M out of Ether funds.
1. THE WEEK IN DOMINANCE
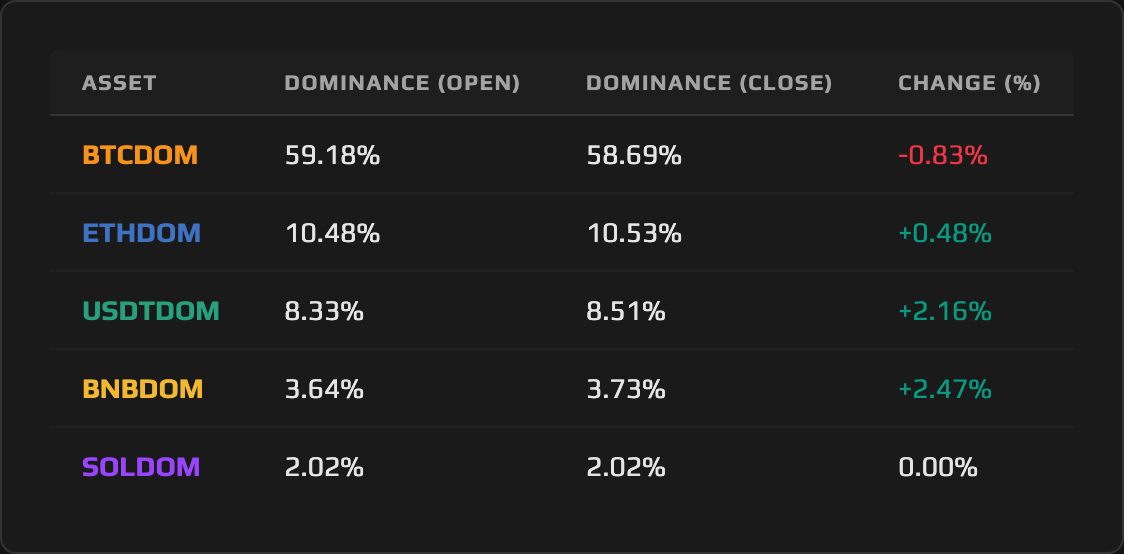
Bitcoin Dominance was the only reading to fall this week, alone, while the total crypto market contracted 2.29% and BNBDOM, ETHDOM, SOLDOM, and USDTDOM all rose or held their ground. The selling was concentrated in the Bitcoin wrapper: US spot Bitcoin ETFs shed $385.2 million against just $3.0 million out of Ether funds. BNBDOM led the gainers at +2.47%, most of it inside a single 13-hour window; USDTDOM’s +2.16% arrived from the cash pile standing still while the market around it shrank, not from capital arriving.
2. MACRO CONTEXT — THE BACKDROP
Total crypto market cap fell 2.29% over the week, the benchmark every dominance outcome in this issue is measured against. Anything that fell less than that pace gained share; anything that fell more, lost it. That comparison is the spine of the issue.
The week’s data event landed Wednesday, August 12, when July’s US CPI printed exactly in line: +0.1% month over month, 3.4% year over year, with core CPI at +0.2% monthly and 2.5% annually. The in-line read produced no relief rally, and institutional flows gave no follow-through. ETF flows flipped negative across three consecutive outflow days, August 10 through 14, a reversal from the roughly $854 million inflow week that had opened the month.
The Fear & Greed Index read 37, Fear, on August 14, down from Neutral territory a week earlier. Bitcoin ended the week near $62,843 and XRP broke below $1, both consistent with a market that spent the week de-risking rather than rotating.
3. ASSET DEEP DIVE
Bitcoin (BTC) Dominance
Open Price: 59.18% / Close Price: 58.69% / WoW Change: −0.83%
The Structure
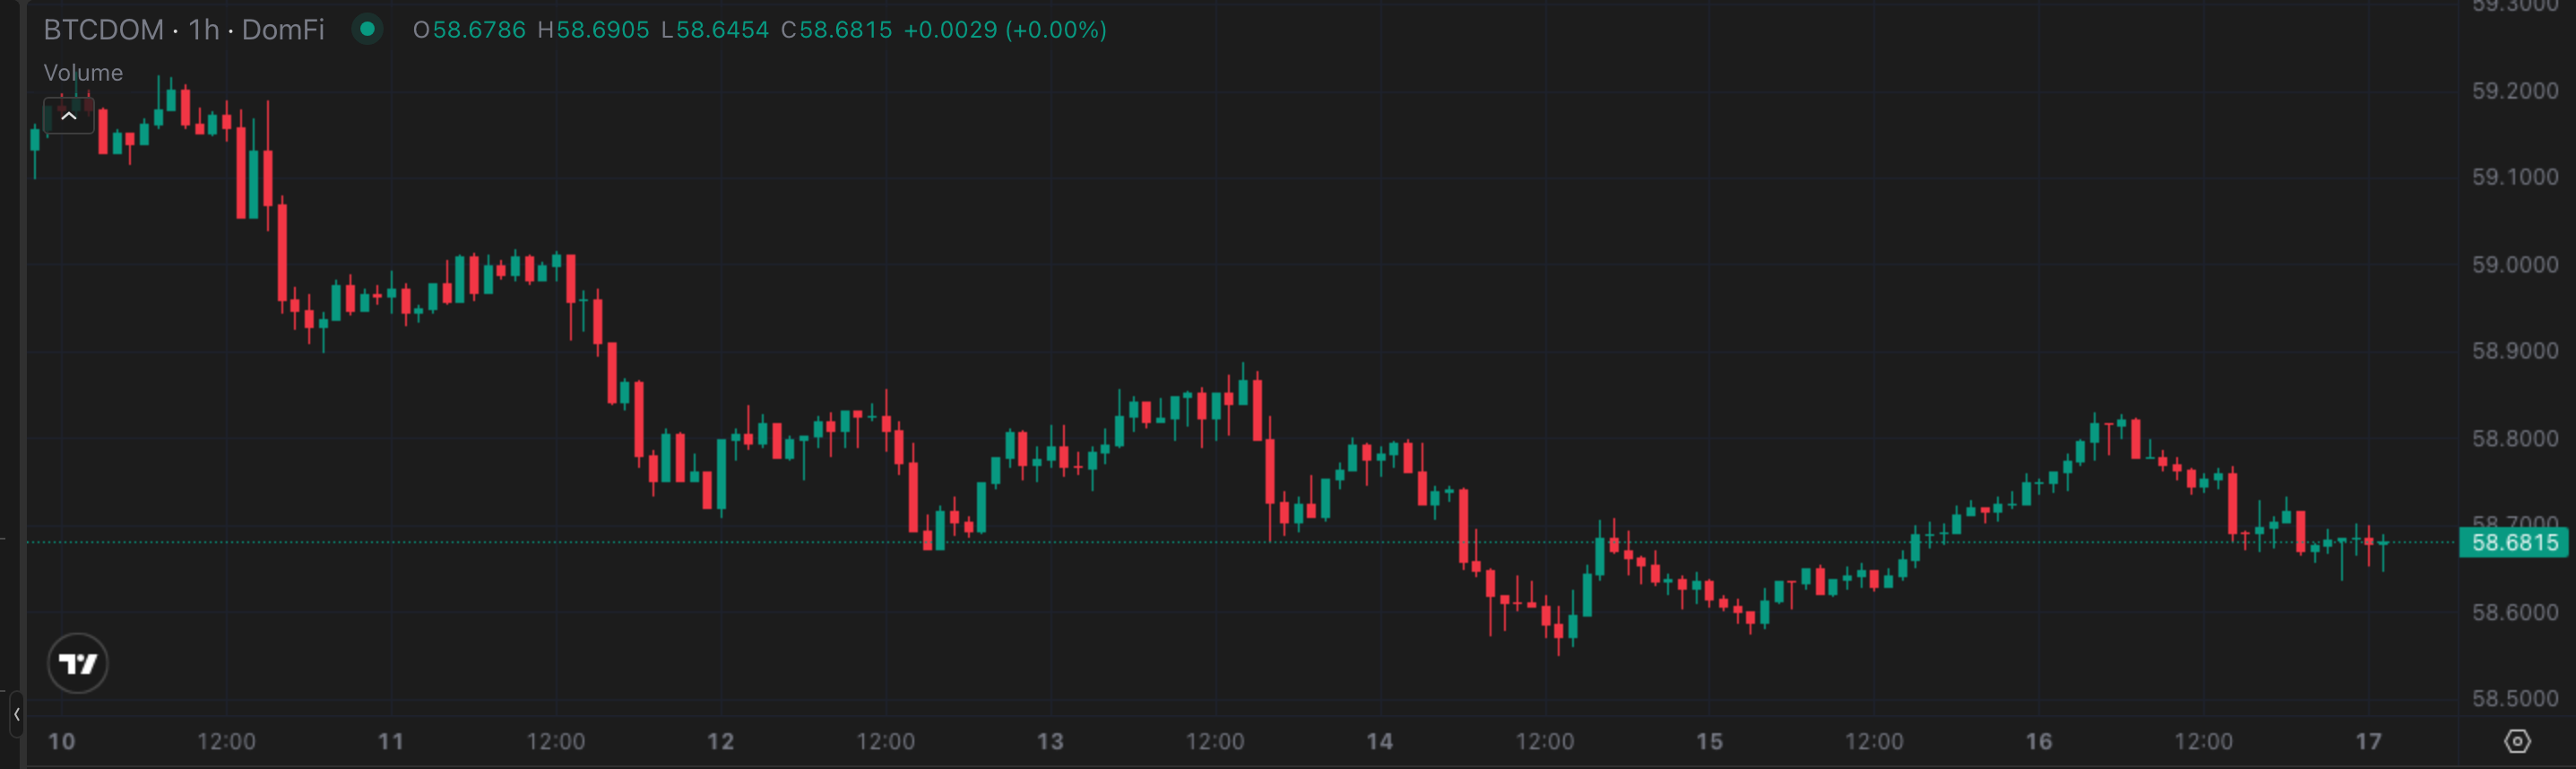
Bitcoin Dominance has traded roughly 58.36% to 59.38% since mid-July. It opened this week at 59.18%, near the top of that range, and closed at 58.69%, in the lower half. The 59.00% level held as support from Monday afternoon through Tuesday midday, broke during Tuesday afternoon, and was never reclaimed for the rest of the week: support turned resistance. After that break, 58.89% capped every attempt higher. The daily highs from Wednesday on read 58.86%, 58.89%, 58.80%, 58.76%, and 58.83%, a descending sequence pressing against a level that would not give way. The intraweek low of 58.55% printed Friday, and the back half of the week settled into a range between that low and 58.89%. The 1.14% swing is the tightest on the board. BTCDOM drifted; it did not whipsaw.
This Week’s Price Action
The decline was front-loaded into two legs, not a week of steady bleeding. The first ran Monday from 12:00 to 16:00 UTC, taking BTCDOM from 59.16% down to 58.96% and producing the first break of the 59.00% support. A shelf held overnight and through Tuesday morning, with hourly closes sitting between 58.94% and 59.01%. The second leg, the decisive one, ran Tuesday from 12:00 to 23:00 UTC, from 59.01% down to 58.72%. From Wednesday onward, Bitcoin Dominance did nothing but range. BTCDOM lost effectively all of its weekly ground inside the first 48 hours, then spent five days going sideways. One detail deserves direct attention: that same Tuesday window is when BNBDOM ramped to its own weekly high. One session did most of the week’s work.
The Daily View
The daily 00:00 UTC sequence reads 59.181% Monday, 58.963% Tuesday, 58.720% Wednesday, 58.776% Thursday, 58.777% Friday, 58.635% Saturday, and 58.749% Sunday, closing the week at 58.69%. Two decisive down days, then four readings packed inside a 0.14% band. Momentum stopped; it neither reversed nor continued. The prior week opened at 58.85% and closed at 59.18%, and this week’s 58.69% close sits below where that prior week began. The week did not just retrace; it erased the previous week’s entire advance.
The Why
Across the last twelve weeks, tracked back to late May, no other week has produced this configuration: Bitcoin Dominance falling while the rest of the complex rose or held. The mechanism is a gap between two rates of decline. BTC’s market cap fell 3.10% while the market around it fell 2.29%, and that gap is the lost share. Why Bitcoin fell faster than the complex it is measured against comes down to two channels carrying outsized selling isolated to Bitcoin.
The ETF wrapper turned seller. US spot Bitcoin ETFs saw $385.2 million of outflows over the week against $3.0 million out of Ether funds, a ratio of roughly 128 to 1. Three straight sessions ran negative, August 10 through 14, reversing the roughly $854 million inflow week that had opened the month. The wrapper that had functioned as Bitcoin’s marginal bid became a source of supply instead. Corporate treasuries added to it: MicroStrategy and Hut 8 sold more than $134 million in BTC during the week, with Strategy disclosing 1,690 BTC sold between August 3 and 9 for roughly $108.6 million.
Both are significant factors, neither alone accounts for the full move, and the market’s own 2.29% contraction sits alongside them. July’s CPI print landing in line on Wednesday, August 12, is scene-setting here, not cause: a market-wide print moves the whole complex at once and largely cancels out of a ratio, which is exactly why it cannot explain BTCDOM losing ground while BNBDOM, ETHDOM, SOLDOM, and USDTDOM did not. The sharpest read: the pairs that gained share did not do so by attracting the capital Bitcoin lost. Aggregate stablecoin supply was flat, ETH’s price fell, and SOL’s price fell. This was supply leaving Bitcoin, not capital rotating into anything else.
The Outlook
58.89% is the level to watch first: BTCDOM needs a close above it to signal the two-leg decline is finished, since it capped every bounce from Wednesday onward. 59.00% is the bigger test above that, the support it lost on Tuesday and has not taken back. Below, 58.55% is the intraweek low, and it has to hold for the current range to stay a range rather than become a new leg down. The forward risk sits in the ETF flow channel: three consecutive outflow days is the condition that produced this week’s move, and if that pattern persists, 58.55% gets tested directly. If flows stabilize instead, the 58.55% to 58.89% band holds and BTCDOM spends another week doing very little. Wednesday’s FOMC Minutes is the one scheduled release capable of repricing the whole complex at once.
Trade BTCDOM: https://app.domination.finance/BTCDOM
4. THE DOMINANCE MATRIX
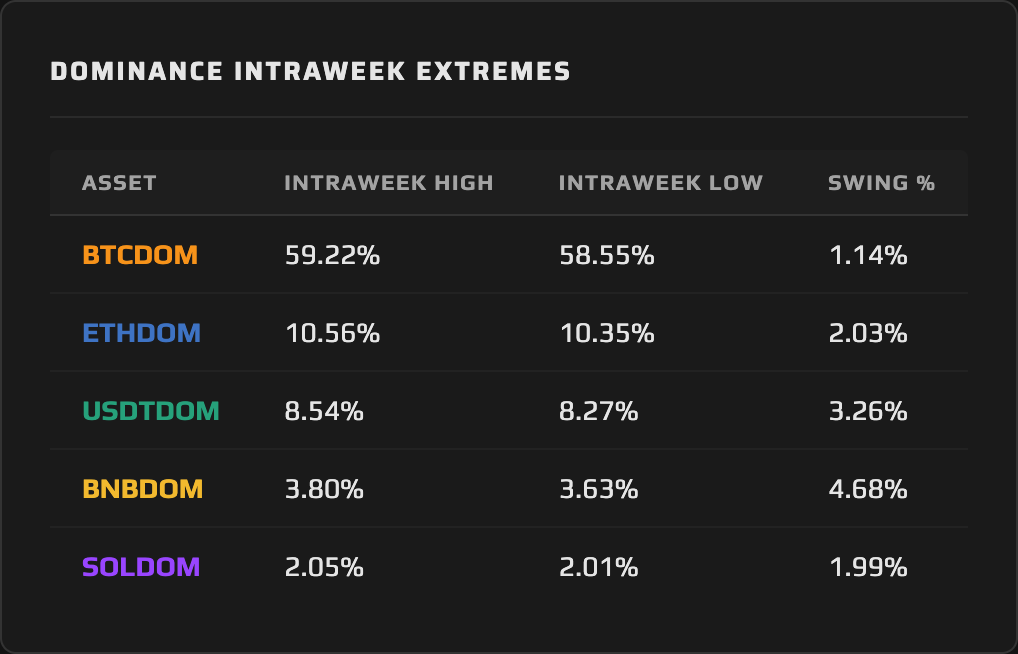
The sharpest structure among the remaining pairs is a contrast, not a shared narrative. BNBDOM and USDTDOM sit almost on top of each other, +2.47% and +2.16%, having arrived at nearly identical numbers through opposite mechanisms. ETHDOM and SOLDOM sit together at the bottom, +0.48% and unchanged, both earned by falling less than the market.
BNB Dominance led the board at +2.47%, climbing from 3.64% to 3.73% on a 4.68% swing, the widest of the week, and nearly all of that gain accrued in roughly 13 hours. The hourly closes from Tuesday climbed in an unbroken run from 3.6995% to 3.7796% before the 3.80% print landed Wednesday. Before that window BNBDOM had gone from 3.645% Monday to only 3.664% Tuesday; after it, four and a half days of ranging, giving ground back into the close. This was not a week-long climb. The catalyst arrived on August 11, when Binance posted a single word, “Soon,” on X, alongside an image of a device under a gold cloth with a “Continue to X” button visible beneath. Traders read it as a teased integration, speculation centering on Binance Pay reaching X’s distribution; neither company confirmed a partnership, and no product, scope, or date has been disclosed. The price followed within hours: BNB rose more than 3% to a three-week high of $620 on Wednesday, and open interest topped $1 billion. BNB closed the week at $602.46 against a $601.84 open, the only asset that finished higher in price, while the market around it contracted 2.29%. Both mechanisms, a price that held and a market that shrank, contributed to the number.
Tether Dominance arrived within striking distance of that same number, +2.16%, climbing from 8.33% to 8.51% by doing the exact opposite. Aggregate stablecoin supply was flat over the week, +0.02%, $306.14 billion to $306.19 billion, and USDT’s own circulating supply has been contracting, down roughly $4 billion over the preceding 60 days according to reporting from August 12. This is not an inflow. Nothing arrived. The cash pile stood still while the market around it shrank. The timing deserves drawing out on its own: USDTDOM’s 8.54% high printed Friday, an hour after BTCDOM’s 58.55% low, the same session producing two readings from one event. BNBDOM got its number from a catalyst and a price that held; USDTDOM got a comparable number from nothing happening at all. Same magnitude, opposite cause.
Ethereum Dominance gained 0.48%, closing at 10.53% against a 10.48% open, while ETH’s price fell 1.81%. It fell less than the market’s 2.29% pace, and that gap is the share gain. ETH ended near $1,874 and has not reclaimed $1,900. ETHDOM dipped to 10.383% Tuesday, then built six straight higher daily readings into the close, the steadiest curve of the week. Solana Dominance closed exactly where it opened, 2.02%. SOL’s price fell 2.19% against the market’s 2.29% decline, tracking it closely enough that the reading never moved. SOLDOM tagged 2.05% Friday morning and gave it back over the weekend, so the flat close hides real intraweek movement. Solana ETF inflows hit a three-month high in the week ending August 11, and the network heads into the SIMD vote close and the Agave 4.2 activation. Flat is not dormant.
Synthesis: every pair other than Bitcoin held its ground against a market that fell 2.29% this week, which makes this a de-rating of Bitcoin specifically rather than a risk event shared across the dominance charts.
5. THE WEEK AHEAD — EVENTS CALENDAR
Monday, August 17 — Agave 4.2 feature activations begin on Solana mainnet (90% rent reduction, larger transaction sizes, reduced slot times).
Tuesday, August 18 — Solana SGP-0003 validator vote closes: SIMD-0553 (resource-based transaction fees, raising daily SOL burns from roughly 650 to between 7,500 and 9,000) and SIMD-0550 (annual disinflation rate doubling from 15% to 30%). Requires 15% of staked SOL; support at 14.4%, or 63 million SOL.
Wednesday, August 19 — FOMC Minutes, July 28–29 meeting (Rate held at 3.50–3.75% on a 9–3 vote; Hammack, Kashkari, and Logan dissented in favor of a quarter-point hike).
What to Watch for Dominance: Whether Bitcoin Dominance stays the lone decliner is next week’s open question, and the ETF flow channel is what decides it: BTCDOM enters the week inside the 58.55% to 58.89% range that formed after Tuesday’s break, and a continuation of outflows tests the bottom of it. Monday’s Agave 4.2 activation and Tuesday’s SIMD vote close are the week’s two Solana-native events, landing directly against SOLDOM’s flat 2.02% close. Wednesday’s FOMC Minutes is the one scheduled release capable of repricing the whole complex at once.
6. CLOSING REMARK
A week where Bitcoin Dominance falls and BNBDOM, ETHDOM, SOLDOM, and USDTDOM hold or gain is not a broad risk event. The dominance charts describe a Bitcoin-specific de-rating instead, and across the last twelve weeks, no other week has produced Bitcoin Dominance falling alone while every other pair held or gained.
The share Bitcoin gave up did not go anywhere in particular; none of the pairs that gained did so by pulling in the capital Bitcoin lost. Supply left Bitcoin through two channels, the ETF wrapper that flipped from buyer to seller across three consecutive sessions in the red and the corporate treasuries selling alongside it, while the rest of the board simply stood still and let the share come to it. Carry 58.89% and the ETF flow channel into next week: whichever gives first decides whether Bitcoin’s isolation was a single bad week or the start of something longer.
- Trade on DomFi: https://app.domination.finance/
- Deposit USDC into the Vault: https://app.domination.finance/vault
- Make a Referral Code: https://app.domination.finance/referrals
- Join our Discord: https://discord.com/invite/6wG5cdNSbM
This content is produced by domination.finance for informational and educational purposes only. Nothing contained herein constitutes financial or investment advice. Always conduct your own research.