Dominance Debrief #2
USDTDOM surged +3.23% in a week the total market fell −3.02%. BTCDOM was the lone risk-asset winner. SOLDOM bled −2.88%. The quality sort has begun.
THE DOMINANCE DEBRIEF
Week of March 23 – March 29, 2026
Issue #2
TL;DR: USDTDOM surged +3.23% in a week the total market fell −3.02%. BTCDOM was the lone risk-asset winner. SOLDOM bled −2.88%. The quality sort has begun.
1. THE WEEK IN DOMINANCE
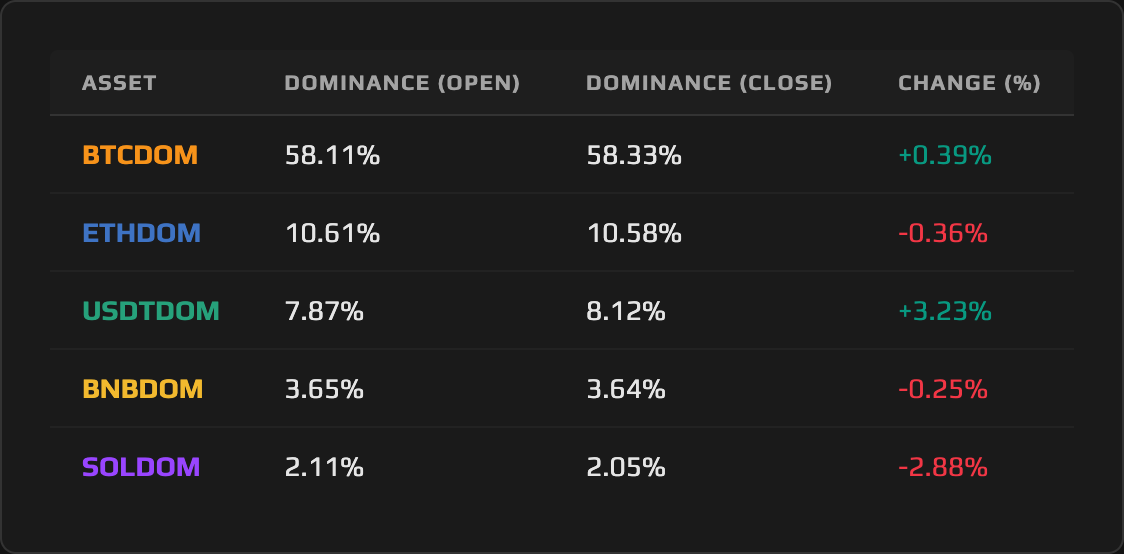
The defining story of March 23–29 is not what Tether Dominance did. It is what it reveals about the forces behind it. USDTDOM surged +3.23%, moving from 7.87% to 8.12%, while total crypto market cap fell −3.02% over the week. That denominator compression was a significant amplifier of the USDTDOM reading. At the same time, total stablecoin supply dipped marginally (from $315.32B to $314.39B in aggregate), though USDT itself absorbed inflows as capital rotated out of competing stablecoins. Both sides of the ratio were in motion. Meanwhile, BTCDOM was the only risk asset to post a positive dominance reading — a +0.39% gain that reflects BTC’s relative resilience as the market shed value around it. SOLDOM suffered the sharpest loss at −2.88%, ETHDOM shed −0.36%, and BNBDOM declined −0.25%. The dominance charts this week describe a quality ladder: capital moved from smaller-cap risk toward BTC and stablecoins, while the denominator contracted underneath all of it.
2. MACRO CONTEXT — THE BACKDROP
The total crypto market cap declined from approximately $2.318 trillion on Monday open to $2.248 trillion by Sunday’s close, a −3.02% contraction that played out against one of the most compressed geopolitical backdrops of the year. President Trump’s Iran ultimatum entered its third week of extension and counter-extension. After postponing strikes on March 23, issuing a new window on March 25, and extending again on March 26, the administration ultimately set April 6 as the final deadline. The Strait of Hormuz has been effectively closed since March 2, disrupting approximately 17.8 million barrels per day. WTI crude closed the week at $99.64, its highest print since 2022, and Brent reached $112.57. An oil shock of this magnitude historically drains liquidity from risk assets by hardening inflation expectations, and crypto traded in lockstep with that dynamic.
The Federal Reserve’s March 18 hold at 3.50–3.75% continued to cast its shadow. The dot plot’s lone cut projection for 2026 and the revised 2.7% PCE forecast created a ceiling on rate-cut optimism that the geopolitical situation then reinforced. There was no PCE release this week; that data point waits until April 9. The market had nothing macro to trade against except the Iran headlines and their implied commodity shock. Treasury auctions in 2Y, 5Y, and 7Y notes ran through the week, absorbing additional liquidity from a market already running lean. The Bank of England had held at 3.75% on March 19 with a unanimously hawkish tone, citing inflation risk from the Middle East conflict; international central banks were closing ranks around the same hold posture the Fed established on March 18. The Fear & Greed Index sat at 8 on Monday, briefly reached 14 on Wednesday, and closed the week at 9. It did not leave Extreme Fear territory for a single day.
The crypto-specific events compounded the macro pressure. David Sacks’s departure as Crypto Czar on March 26 removed the most visible regulatory champion from the White House at the precise moment the CLARITY Act needed its loudest advocate. The $14.16 billion BTC options expiry on March 27 (the largest of 2026, with max pain at $74,000–$75,000 against spot closer to $66,500) produced $300–$450 million in liquidations, predominantly longs. March 26 also delivered the first simultaneous net-outflow day of 2026 across BTC, ETH, and SOL spot ETFs. The market’s structure was deteriorating on multiple axes simultaneously.
3. ASSET DEEP DIVE
Tether (USDT) Dominance
Open: 7.87% / Close: 8.12% / WoW Change: +3.23%
The Structure
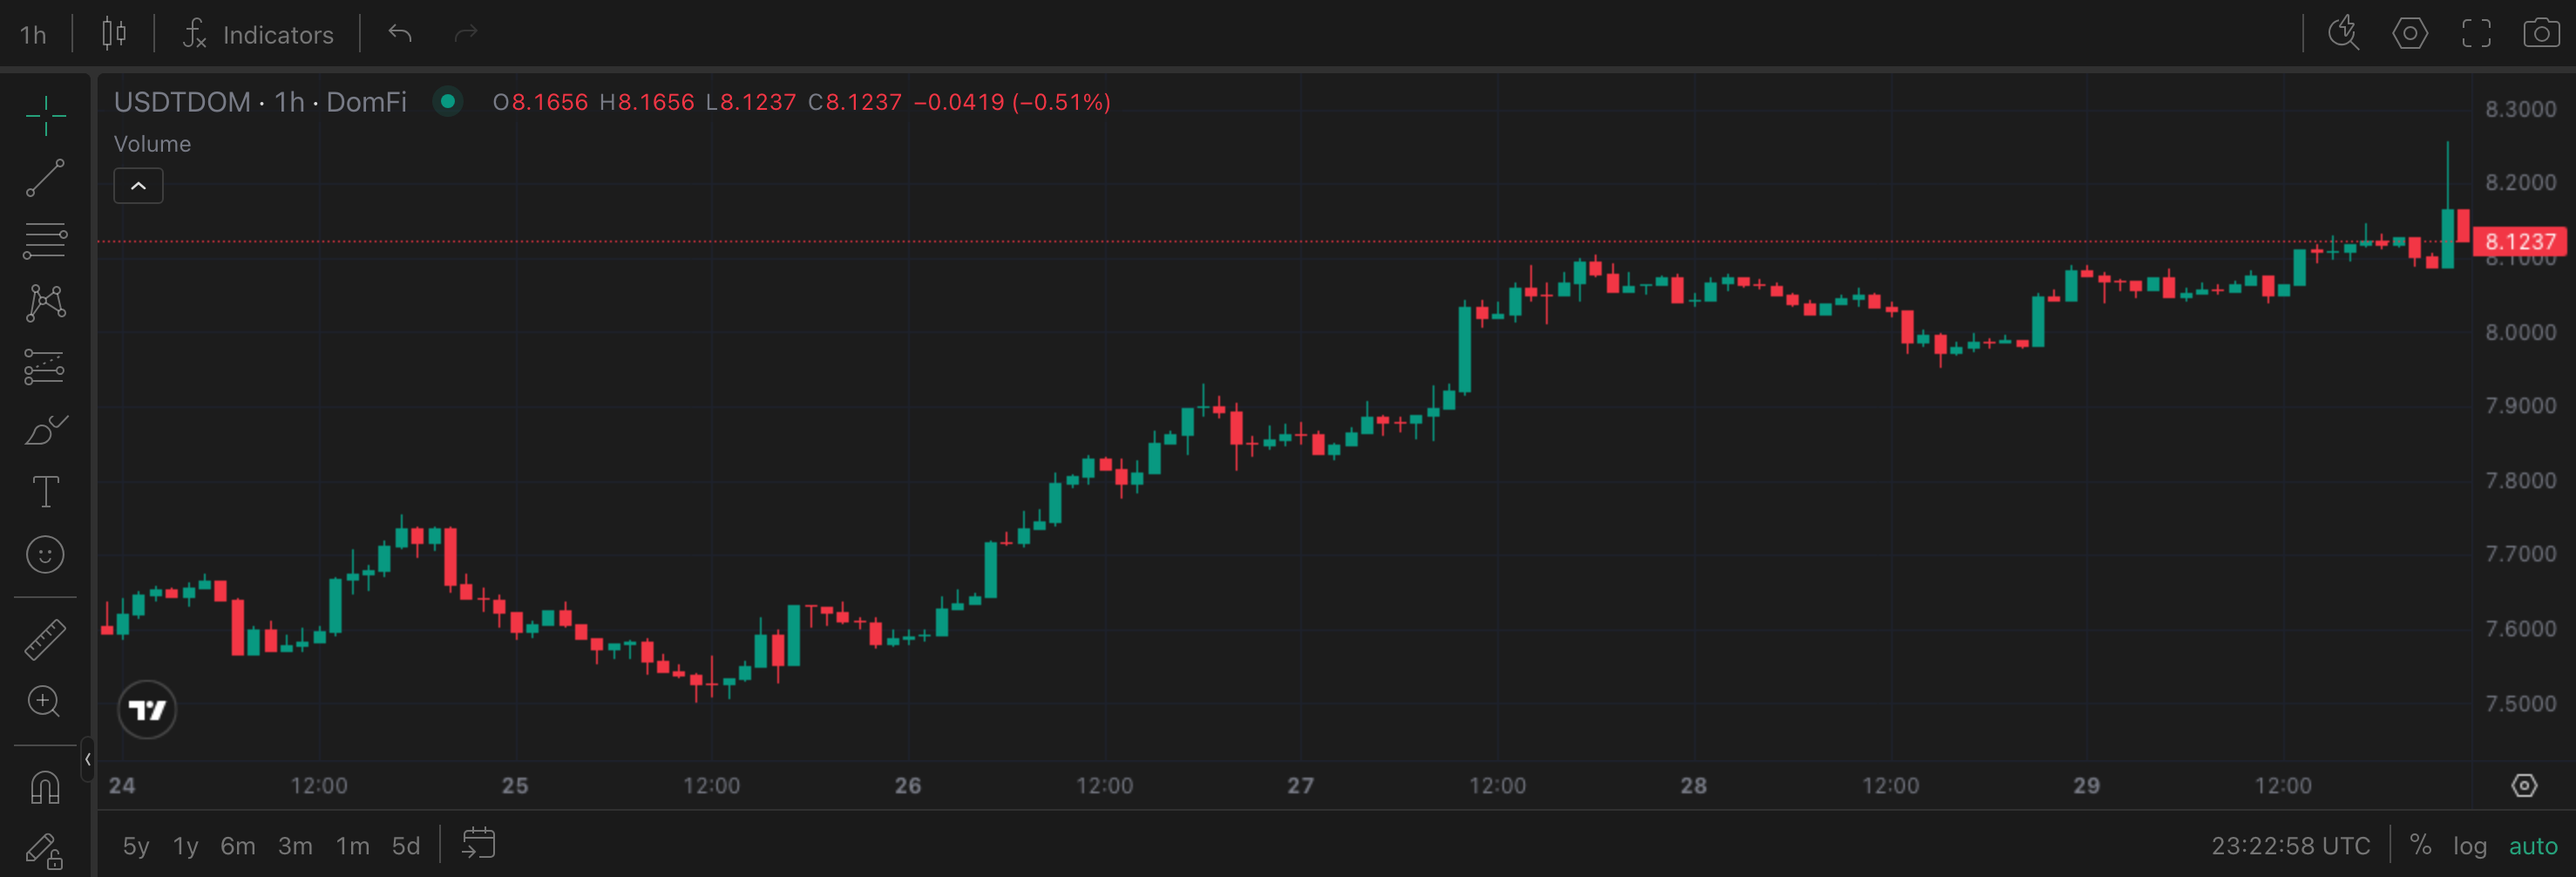
Tether Dominance arrived at this week’s open already in expansion. The move from 7.87% to 8.12% extends the higher-low/higher-high structure that has been constructing on the weekly timeframe since late February, when USDTDOM was trading below 7.50%. The 8.00% level that served as the target in last week’s outlook has now been breached and closed above: at 8.12%, USDTDOM has printed the highest weekly close in the current cycle. The next overhead zone is the 8.20%–8.30% band that marked the intraweek high. A weekly close above 8.30% would confirm the expansion as structural, not a temporary flush driven by macro noise.
This Week’s Price Action
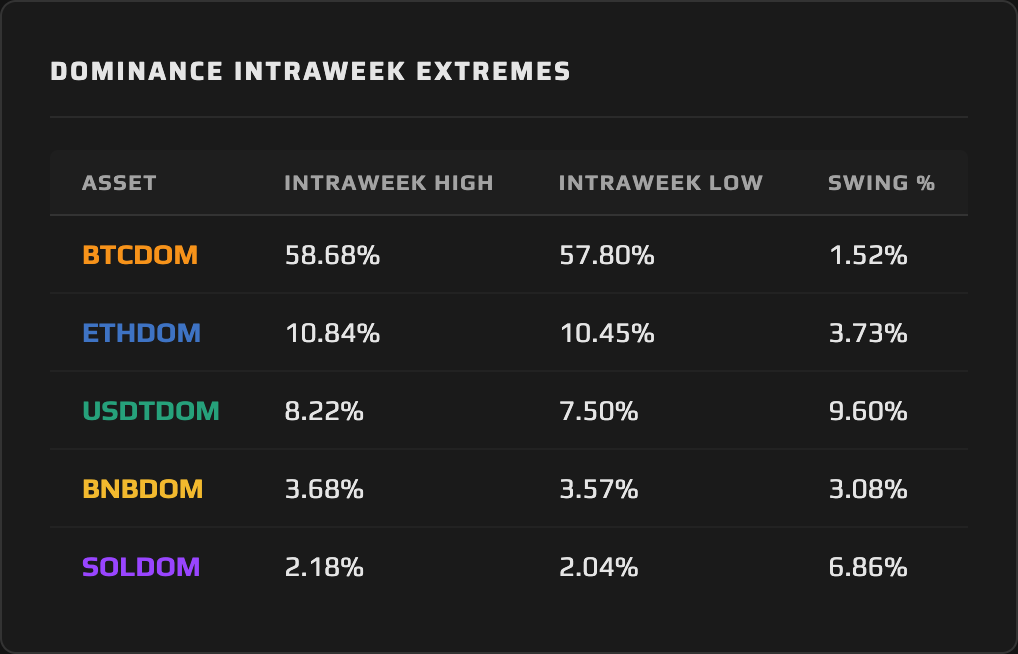
The weekly candle conceals a violent intraweek structure. USDTDOM opened at 7.87% and immediately collapsed to 7.50%, a −4.70% intraweek drop from open to low that arrived in the first trading sessions of the week as a brief risk-on window cracked open. That low was decisive: once the Iran news cycle resumed and the Sacks exit registered, USDTDOM reversed sharply and ran to a weekly high of 8.22% before settling at the 8.12% close. The full intraweek range — 7.50% to 8.22% — is a swing of 9.60% measured against the open. That is the kind of intraweek volatility that is typically associated with sharp directional conviction, and the conviction here ran toward safety.
The Daily View
The daily candle structure breaks into three phases. The opening period saw Tether Dominance pushed down to 7.50%. That floor coincided precisely with early-week optimism around a possible Iran de-escalation, which briefly sent BTC above $68,000 and compressed USDTDOM as capital tilted toward risk. The second phase was the reversal: Iran rejected the ceasefire and published five counter-conditions on March 25, Trump extended the deadline again on March 26, and USDTDOM climbed through 7.87% (its open) and then pushed through 8.00% for the first time this cycle. The third phase was consolidation and the Sacks exit: USDTDOM reached 8.22% on March 27 as the options expiry delivered its liquidation cascade, then drifted to the 8.12% close as the immediate shock absorbed. The daily structure is a textbook reversal pattern — deep early flush followed by a sustained, multi-session bid that did not give back.
The Why
The analytical picture behind this week’s USDTDOM surge has two distinct components, and conflating them produces the wrong read. The first is denominator compression: the total crypto market cap fell −3.02%, and when the denominator shrinks, every stablecoin’s dominance reading rises automatically, and that mechanical lift accounts for a meaningful share of USDTDOM’s +3.23% gain. The second is USDT-specific inflows: while aggregate stablecoin supply declined marginally from $315.32B to $314.39B in total, USDT itself absorbed approximately $115 million in net inflows over the week as capital rotated out of competing stablecoins, including USDC which shed roughly $150 million. The Tether KPMG audit announcement, a structurally positive development for USDT’s credibility under the GENIUS Act, contributed to that rotation within the stablecoin complex. Capital in a fear environment did not simply flee to stablecoins generically; it chose which stablecoin to trust. That distinction is its own dominance signal, one that the current five-pair framework captures only partially. USDTDOM measures Tether’s share of the total crypto market, but the rotation occurring inside the stablecoin complex (USDT gaining at USDC’s expense) is a dominance story within the dominance story, and one that grows more consequential as the stablecoin market approaches $320 billion. These are categorically different dynamics.
That distinction matters for how to read the broader dominance picture. A classic flight-to-safety USDTDOM surge involves fresh capital entering stablecoins from outside the ecosystem, inflating aggregate supply and driving dominance up from both sides simultaneously. What this week produced was more nuanced: the denominator contracted sharply, amplifying the USDTDOM reading, while USDT simultaneously gained share within the stablecoin complex. Capital that exited BTC, ETH, and SOL did not primarily inflate total stablecoin supply; the exchange flows and on-chain data suggest much of it is leaving the ecosystem entirely, or moving into BTC cold storage. But USDT was not purely a passive bystander. It was both an active destination within stablecoins and a beneficiary of broader market contraction.
The Outlook
The binary from here is cleaner than last week’s. April 6 is now the named deadline: Trump’s Iran ultimatum expires at 8 PM ET on the same day that NFP lands and markets reopen after Good Friday. That is a loaded session that could move USDTDOM by multiple percentage points in either direction. If April 6 passes without military action, or if Iran signals a path to negotiation, the risk-on rotation will be fast and aggressive. USDTDOM will break back below 8.00% in that scenario, and the 7.50% level would be the first support to monitor. If the Strait of Hormuz situation escalates into direct confrontation, USDTDOM pushes through 8.22% and the 8.30%–8.50% band opens. The 8.00% level is now the line: a weekly close below it is the first signal the compression trade is reversing. Until that break arrives, the structure remains in expansion.
4. THE DOMINANCE MATRIX
The Outlier: BTCDOM
Bitcoin Dominance is the structural anomaly in this week’s data, and it is the most consequential signal the dominance charts produced. BTCDOM gained +0.39% (moving from 58.11% to 58.33%) in a week where BTC’s spot price fell −2.63%. That combination has a specific meaning: BTC fell less than the total market, which contracted −3.02%, meaning Bitcoin outperformed the complex it anchors. This is the first week in the current cycle where BTCDOM has posted a positive reading during a broad market selloff. Last week, Bitcoin Dominance was among the heaviest bleeders. This week, it is the lone risk-asset winner.
The intraweek data sharpens the picture. BTCDOM touched an intraweek low of 57.80%, a brief excursion during the early-week risk-on window, before recovering through the open and closing at 58.33%. That low-to-close recovery, from 57.80% to 58.33%, reflects a specific market behavior: capital cycling out of smaller-cap risk assets and landing in BTC rather than exiting crypto entirely. The 47,000+ BTC that left centralized exchanges during March, the exchange whale ratio at 0.64 (its highest since October 2015), and the whale accumulation of approximately 91,000 BTC over the past 90 days all support the same read. Bitcoin is absorbing rotation from the lower quality tiers of the risk curve.
The Cluster: ETHDOM and BNBDOM
Ethereum Dominance and BNB Dominance arrive at the same analytical zone from different starting points. ETHDOM declined −0.36%, from 10.61% to 10.58%, while BNBDOM declined −0.25%, from 3.65% to 3.64%. These are the smallest weekly losses in the matrix, and they arrive by different mechanisms that produce a surface-level similarity while concealing fundamentally different structural dynamics.
ETHDOM’s −0.36% carries unusual weight given that ETH broke below $2,000 this week, a level that sits 60% below the August 2025 high and that many participants regarded as a structural floor. ETH spot ETF flows delivered seven to eight consecutive days of net outflows heading into the week. By all price and flow metrics, ETH had the ingredients of a sharp dominance contraction. That Ethereum Dominance held at −0.36% while its price fell −3.35% suggests the compression is already in the valuation; expectations have been reset low enough that the marginal seller is exhausted. The 10.40%–10.45% band, which served as the intraweek low, is emerging as meaningful support.
BNBDOM’s −0.25% tells a different story. BNB Dominance is the quietest pair in the matrix this week, and quiet is its own signal. BNB dropped −3.28% in price, similar in magnitude to ETH, but BNBDOM barely moved. Exchange-native utility creates a structural floor for BNB Dominance during broad selloffs: BNB’s use case as a fee discount and ecosystem access token generates organic demand that is relatively insensitive to pure risk sentiment. The 3.57% intraweek low held without threatening the 3.50% structural floor. BNBDOM is in stasis while the rest of the matrix moves.
The Bleeder: SOLDOM
Solana Dominance declined −2.88%, from 2.11% to 2.05%, the steepest weekly loss of any tracked pair. SOL’s price fell −5.83%, more than double BTC’s −2.63% decline, and the network metrics compound the picture: transactions down 3.2%, active addresses down 11%, network fees down 31% over 30 days, and overall network activity 72% below the cycle high. The intraweek high of 2.18% arrived midweek and then completely reversed — the pattern is consistent with last week’s failed breakout structure where a brief catalyst spike gave way to macro-driven compression. What was resistance at 2.18% last week has now confirmed itself as a ceiling.
SOLDOM at 2.05% is now testing its intraweek low as the closing level. That close-at-the-low structure is a distinctive bear signal in dominance terms: buyers showed up at 2.04% during the week, but not in sufficient size to prevent a close at 2.05%. The quality rotation thesis runs directly through SOL. It is the asset at the bottom of the quality ladder among the five tracked pairs, and in a week defined by capital moving up that ladder toward BTC and stablecoins, SOLDOM was the natural destination for outflows.
Synthesis: The full dominance picture this week describes a quality rotation in progress, not a uniform risk-off flush. BTCDOM gained while SOLDOM bled, ETHDOM and BNBDOM held near-flat, and USDTDOM surged on a combination of denominator compression and USDT-specific share gains within the stablecoin complex. Capital is moving up the risk ladder, from SOL to BTC and from BTC to cold storage, while the ecosystem itself contracts. This is a different regime from last week’s broad deleveraging: the directional sort has begun.
5. THE WEEK AHEAD — EVENTS CALENDAR
Tuesday, March 31 — Consumer Confidence (Conference Board) | Prior: 91.2 | Q1 close. Chainalysis Links conference opens in New York (runs through April 1).
Wednesday, April 1 — ISM Manufacturing PMI (Feb: 52.4, Jan: 52.6) | ISM Prices Paid | US Retail Sales | Celestia (TIA) unlocks 175.6M tokens (~17.2% of circulating supply). Sui unlocks 53.4M SUI (~$47.5M). Aave/BGD Labs technical partnership formally ends following December 2025 governance tensions.
Thursday, April 2 — ADP Employment (Consensus: +42K | Prior: +63K) | Ethena (ENA) unlocks 300M tokens (~2% of supply).
Friday, April 3 — NFP (Consensus: +56K | Prior: −92K; unemployment: 4.4%, labor force participation: 62.0%) | Wormhole (W) unlocks ~600M tokens (~6% of supply). US, Australian, and Canadian markets closed for Good Friday.
What to Watch for Dominance: The pressure on altcoin dominance builds mid-week and does not wait for any single catalyst. The Celestia unlock on April 1 hits a market already running below key support levels; 17.2% of circulating supply entering when sentiment sits at Extreme Fear does not quietly absorb. SOLDOM and altcoin-adjacent dynamics in BNBDOM carry the most direct exposure, and the Sui and Ethena unlocks compound that supply overhang through Thursday. Q1 rebalancing on March 31 introduces a structural wildcard: institutional portfolio adjustments can produce counter-trend flows that temporarily distort dominance readings before the underlying macro trend reasserts. The NFP print on Friday lands into closed markets, compressing two days of positioning into the weekend. If the jobs data is strong and supply overhang gets absorbed without panic, a risk-on lean narrows USDTDOM and gives SOLDOM room to recover from its compressed base. A weak print combined with unresolved geopolitical pressure does the opposite, with USDTDOM pushing toward 8.50% and BTCDOM consolidating its defensive bid.
6. CLOSING REMARK
The dominance charts handed down a more nuanced verdict this week than the headline USDTDOM number suggests. Tether Dominance surged +3.23% — but the mechanism was dual, not singular. The −3.02% total market contraction compressed the denominator and mechanically amplified the USDTDOM reading. Simultaneously, USDT gained share within the stablecoin complex, absorbing inflows as capital rotated out of USDC and other competitors. Total stablecoin supply dipped marginally in aggregate, which means the ecosystem as a whole is not accumulating a large parked-capital position. The rotation into risk, when it arrives, will need to be driven predominantly by fresh demand rather than stablecoin dry powder cycling back into BTC and ETH. And underneath all of that, the dominance lens reveals another layer: USDT absorbing ~$115M in net inflows while USDC shed ~$150M in the same week the KPMG audit landed is a dominance story within the dominance story: a rotation inside the stablecoin complex that tells you where trust is concentrating, not just where capital is parking.
The most meaningful signal this week is BTCDOM’s positive print during a broad selloff. Bitcoin Dominance gaining ground while BTC price fell is the first indicator this cycle that a quality-rotation regime has begun in earnest. Institutions are still buying BTC — quietly, off-exchange, in size — while the altcoin complex deflates around it. SOLDOM’s −2.88% loss, compounding on top of network metrics that sit 72% below the cycle high, frames the rotation vividly. The week ahead will determine whether this quality-sort accelerates into a genuine BTC dominance expansion, or reverses into a broad relief rally. The dominance structure will signal the outcome before price does.
This content is produced by domination.finance for informational and educational purposes only. Nothing contained herein constitutes financial or investment advice. Always conduct your own research.