Dominance Debrief #1
Every risk asset bled dominance this week. USDTDOM was the only winner, surging 5.63%. BTCDOM, ETHDOM, BNBDOM, and SOLDOM all finished red — the cleanest risk-off signal this cycle.
THE DOMINANCE DEBRIEF
Week of March 16 – March 22, 2026
Issue #1
TL;DR: Every risk asset bled dominance this week. USDTDOM was the only winner, surging 5.63%. BTCDOM, ETHDOM, BNBDOM, and SOLDOM all finished red — the cleanest risk-off signal this cycle.
1. THE WEEK IN DOMINANCE
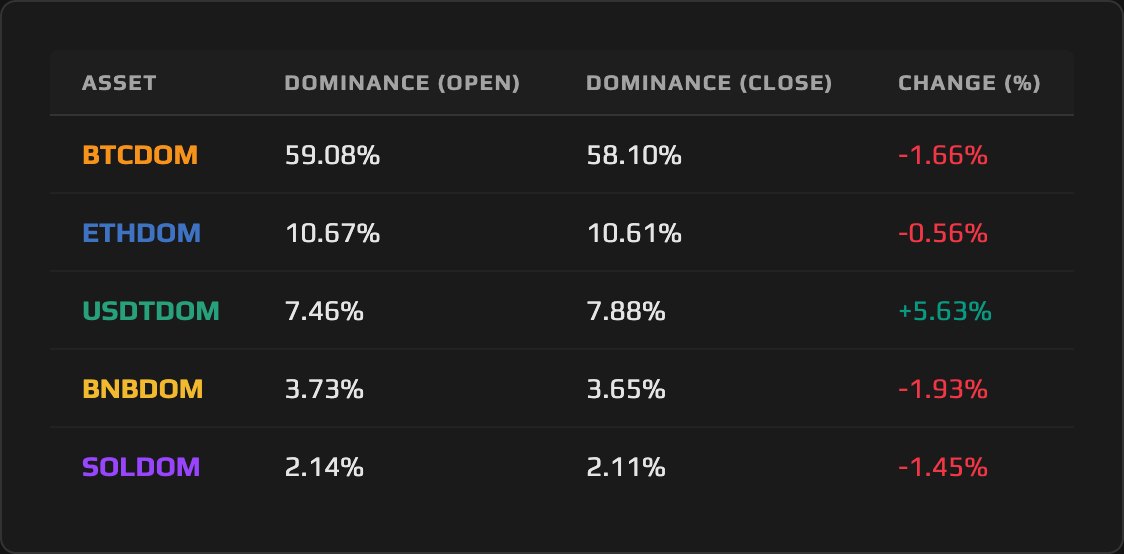
A convergence of three macro shocks: a hawkish Fed hold, a PPI overshoot, and a geopolitical escalation. The result leaves no room for ambiguity: Tether Dominance surged 5.63% while every tracked risk asset lost ground simultaneously. BNBDOM took the worst of it at −1.93%, Bitcoin Dominance followed at −1.66%, SOLDOM declined 1.45%, and even Ethereum Dominance, the week’s relative outperformer, shed 0.56%. This was not rotation between assets. This was a capital retreat from risk itself.
2. MACRO CONTEXT — THE BACKDROP
The total crypto market cap contracted 5.2% over the seven-day window, sliding from approximately $2.44 trillion on Monday open to $2.32 trillion by Sunday’s close. The decline did not arrive in one clean move. It unfolded in two distinct legs. The first was a sharp BTC-driven drawdown on Wednesday in the wake of the FOMC statement. The second, nastier leg came Sunday, when President Trump issued a 48-hour ultimatum on Iranian nuclear facilities and triggered $299 million in liquidations, 85% of which were concentrated in long positions.
The Federal Reserve held rates at 3.50–3.75% at its March 17–18 meeting, a decision the market had fully priced. What it had not priced was the accompanying statement’s hawkish tilt, which pushed June cut probability below 30% on CME FedWatch by Thursday. The same week delivered a PPI print of 0.7% month-over-month against a 0.3% consensus, the largest monthly gain in a year. Together, those two data points dismantled the macro tailwind that had been supporting risk assets since February and replaced it with a higher-for-longer repricing across the curve.
The geopolitical overlay sealed the week’s character. Israeli strikes on Iranian gas infrastructure mid-week had already begun tightening risk sentiment when Trump’s Sunday ultimatum catalyzed the liquidation cascade. The combination of Fed hawkishness, an inflation surprise, and a geopolitical shock produced a risk-off regime that crypto could not absorb. The dominance data confirms it: when every risk asset loses market share in the same week, the market is not rotating. It is deleveraging.
3. ASSET DEEP DIVE
Tether (USDT) Dominance
Open Price: 7.46% / Close Price: 7.88% / WoW Change: +5.63%
The Structure
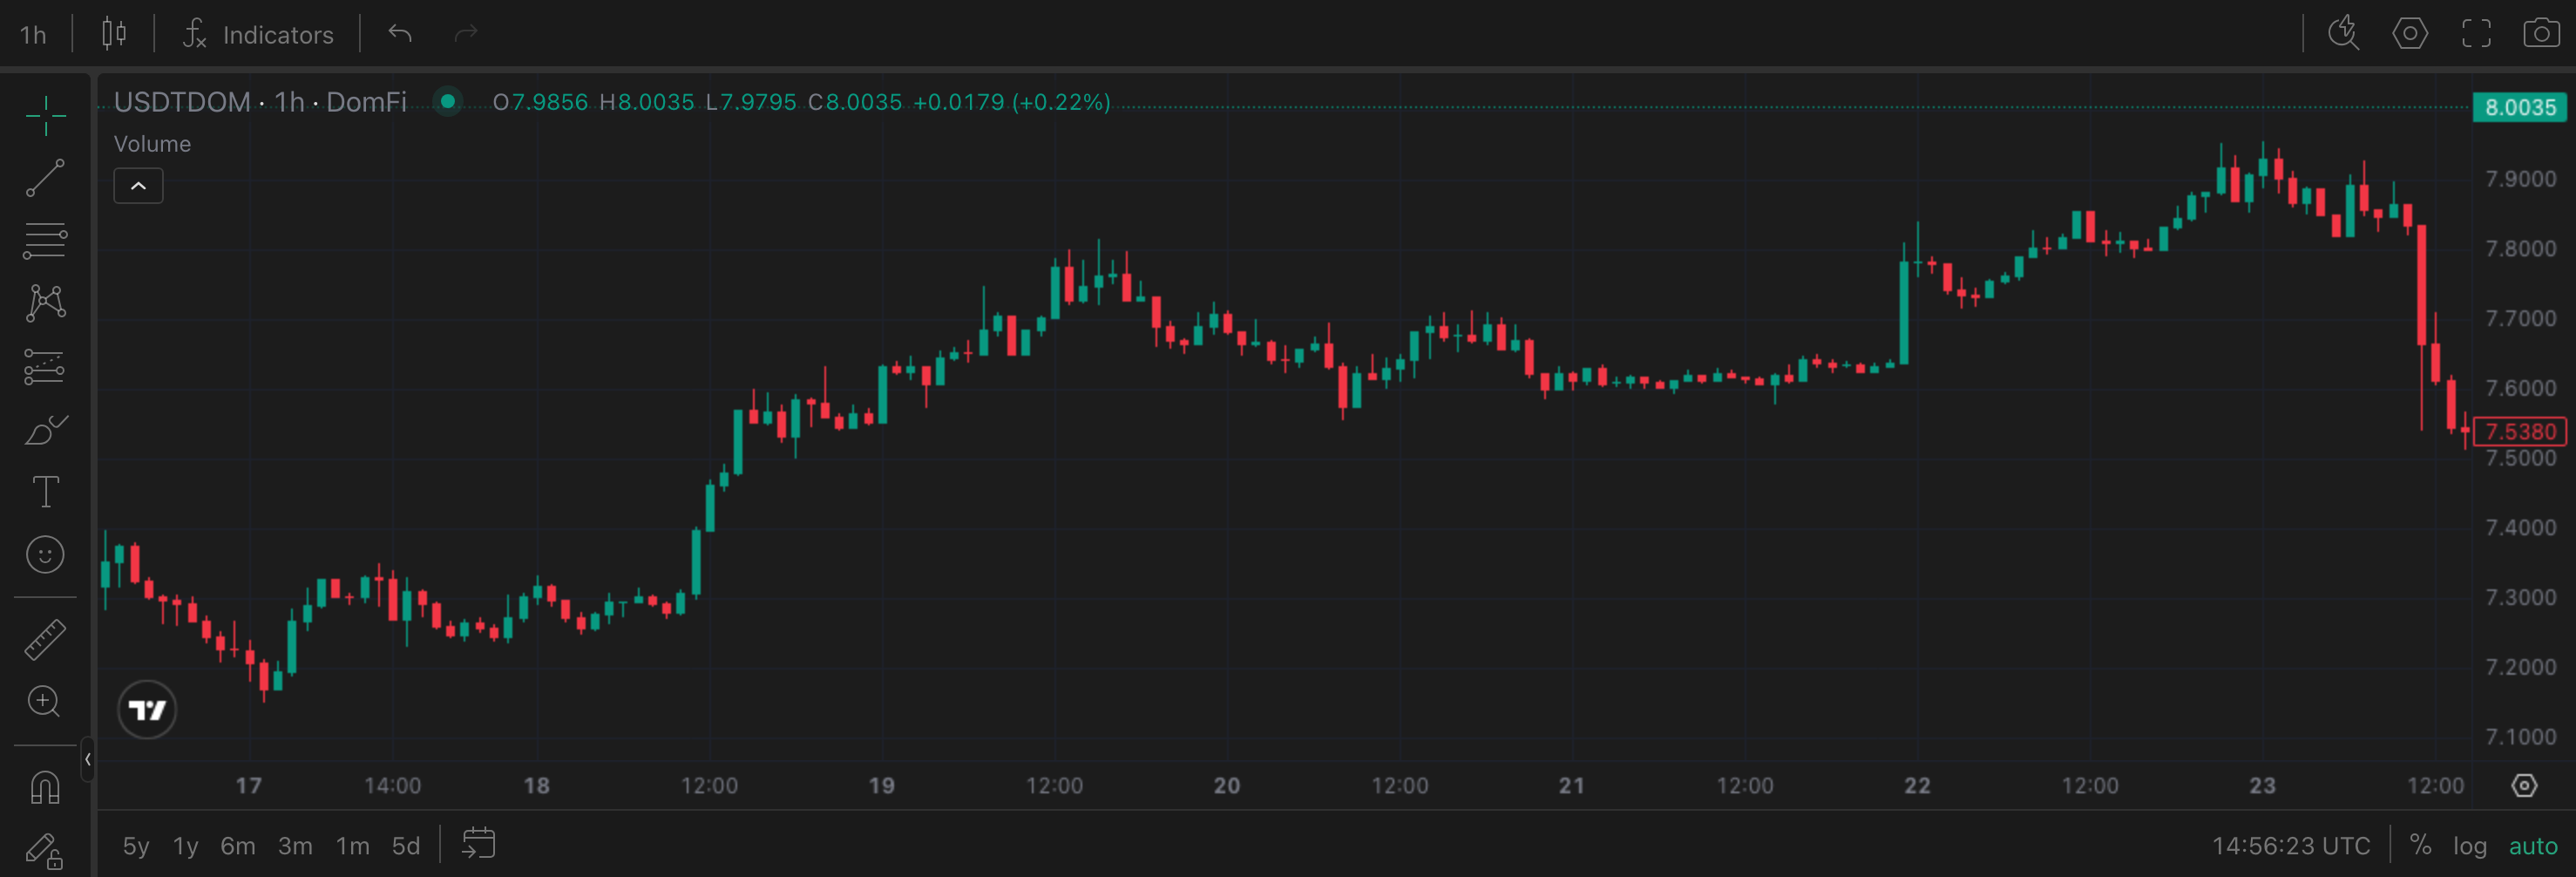
Tether Dominance has been constructing a series of higher-lows and higher-highs on the weekly chart since late February, and this week’s 5.63% surge extends that structure decisively. The move from 7.46% to 7.88% is the largest single-week USDTDOM expansion in the current cycle, a reading that reflects not just the weekly candle but the macro regime underpinning it. The 8.00% level now stands as the next overhead test; a weekly close above it would mark the highest USDTDOM print since January and formally confirm the expansion structure.
This Week’s Price Action
USDT’s peg held at $1.00 throughout the week, as it should. The dominance story here is one of capital allocation, not price. The stablecoin market cap hit an all-time high of $315.5 billion during the period, with Circle minting $2.5 billion in new USDC across Solana and Ethereum. This expansion reflects the core dynamic: capital is exiting risk assets within crypto but not exiting the ecosystem entirely. It is settling into stablecoins, inflating the numerator, and simultaneously compressing the denominator as risk asset prices fall. Both forces pushed Tether Dominance higher, and both forces are still in play.
The Daily View
The intraweek candle structure tells a layered story. The opening period saw USDTDOM dip sharply from 7.56% to a low of 7.14%, corresponding precisely to the ETHDOM spike triggered by the SEC/CFTC “digital commodities” announcement, when capital briefly pivoted toward risk. The recovery was swift: USDTDOM closed the first period at 7.34%, fully reclaiming the ground lost to the risk-on flush. The second period accelerated the expansion leg, running from 7.34% to 7.63% and touching 7.77% intraday as the PPI shock registered. The final period pushed to the weekly close of 7.88%, with an intraweek high of 7.94%.
The Why
Rising USDTDOM carries a specific meaning: the market wants crypto exposure, but not risk asset exposure. This is not capitulation out of the ecosystem. It is parking inside it. The on-chain signals support this reading: BTC exchange reserves hit 7-year lows during the week, indicating that the BTC being sold is moving to cold storage or OTC desks rather than sitting on exchange as stablecoin dry powder. Tether Dominance is therefore rising on two axes simultaneously: fresh minting inflates the numerator while risk asset price declines shrink the denominator. The $315.5 billion stablecoin market cap represents the largest reservoir of redeployable capital this cycle has ever produced.
The Outlook
The binary from here is clean. If the geopolitical situation escalates (if the Iran ultimatum triggers a broader military response), USDTDOM pushes through 8.00% and tests the 8.20–8.30% band. If de-escalation arrives, or if a dovish Fed speaker or strong ETF inflow session provides a risk-on catalyst, Tether Dominance reverses sharply. Stablecoin-to-risk rotations are fast and they do not wait. The 7.50% level is now the structural floor; a retreat below it would be the first signal that genuine risk appetite has returned. Until that break arrives, the trend is unambiguous — expansion.
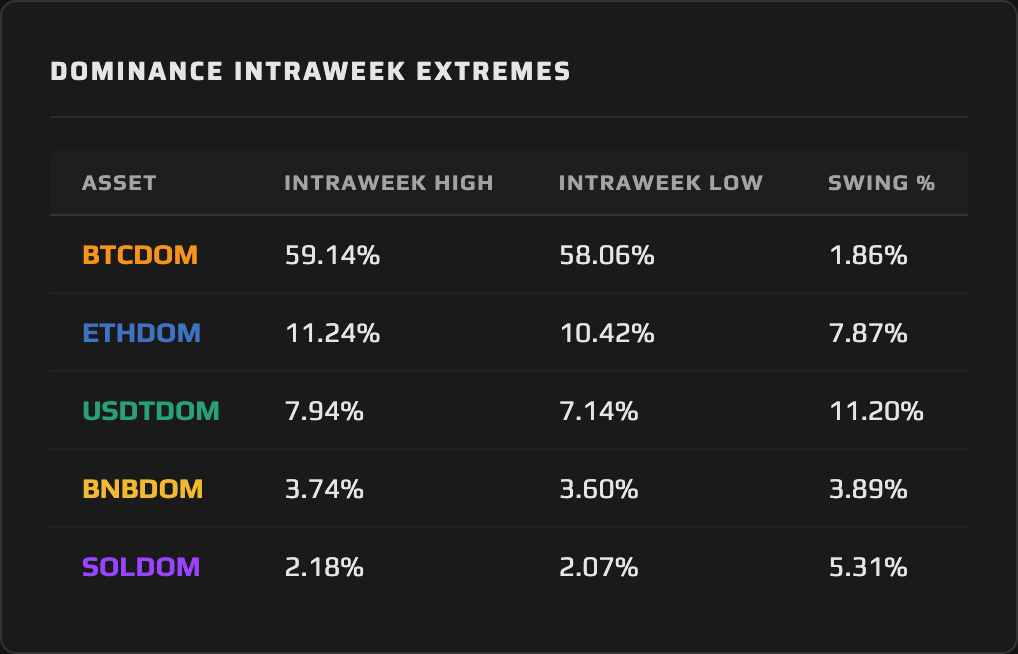
4. THE DOMINANCE MATRIX
The Heavy Bleeders: BNBDOM, BTCDOM, SOLDOM
Three risk assets converged in a tight corridor of pain this week, each losing dominance for reasons that are related but not identical. BNBDOM led the table at −1.93%, moving from 3.73% to 3.65%. That BNB Dominance topped the loss list is the week’s understated surprise: exchange-native utility typically provides a structural floor to BNBDOM during risk-off periods, softening the blow that hits more speculative assets harder. This week, even that floor developed cracks. On a base as thin as 3.73%, the amplification is real. The 3.60% level now functions as the critical line: a close below it would be the first structural breakdown since late February.
Bitcoin Dominance declined 1.66%, from 58.93% to 57.95%, and was the week’s headline dominance story before USDTDOM claimed that title. BTC’s spot price fell 6.80% against a total market decline of 5.2%, meaning BTC actively underperformed the complex it is supposed to anchor. That underperformance during a drawdown has a specific implication: the leverage this cycle was concentrated in BTC. The Sunday $299 million liquidation cascade (85% long positions) confirms where the crowded trades were sitting. BTCDOM is now testing the 58.00% floor. A weekly close below it would formally end the expansion leg that began in mid-February and shift the dominance structure to distribution.
Solana Dominance declined 1.45%, from 2.14% to 2.11%, but the close-to-close number understates the intraweek drama. SOLDOM surged to 2.18% midweek when the SEC and CFTC jointly classified major L1s as “digital commodities,” a genuine regulatory catalyst that eliminated the securities classification overhang SOL had been carrying. The reaction was real, the bid was immediate, and the move above 2.14% briefly looked like a breakout. Then macro fear overwhelmed the narrative. SOLDOM gave back the entire move and more, finishing below its Monday open. The failed breakout above 2.18% is now a resistance level, and until macro conditions stabilize, it will act as a ceiling.
The Quiet One: ETHDOM
Ethereum Dominance tells a fundamentally different story. A decline of 0.56% (from 10.67% to 10.61%) is the smallest weekly dominance move of any tracked risk asset, and by a margin that demands attention. ETH experienced the same midweek SEC/CFTC catalyst as SOL, with ETHDOM spiking to 11.24% before the macro reversal. But where SOLDOM gave back virtually the entire move and still closed lower than where it opened, Ethereum Dominance absorbed the reversal and held. The 10.61% close sits just 0.56% below the 10.67% open, a retention of structure that no other risk asset managed this week.
The divergence between ETHDOM and the heavy-bleeder cluster is the most analytically significant signal in this week’s dominance data. In a week where BTCDOM, BNBDOM, and SOLDOM each lost more than 1.4%, Ethereum Dominance’s 0.56% decline suggests structural demand at current levels, whether from the regulatory reclassification, from relative underperformance that has already compressed expectations, or from quiet accumulation at dominance levels not seen since the early cycle. The 10.40% level remains the structural floor. If ETHDOM holds above it while the heavy bleeders continue lower, the divergence widens into something that will demand a fundamental explanation. That explanation is likely the precursor to rotation.
Synthesis: The full dominance picture this week describes a single regime: broad deleveraging, not sector rotation. BNBDOM (−1.93%), BTCDOM (−1.66%), and SOLDOM (−1.45%) each shed market share for distinct reasons: small-base amplification in BNB, concentrated leverage liquidation in BTC, a failed breakout reversal in SOL. The directional outcome was the same for all three. Ethereum Dominance (−0.56%) stands as the clear outlier, its relative resilience separating it from the cluster in a way that may prove structurally meaningful. Set against Tether Dominance’s 5.63% surge, the combined picture is the dominance charts’ loudest risk-off signal since the current cycle began. The regime shifts when BTCDOM posts a weekly gain while USDTDOM contracts. That reversal has not arrived.
5. THE WEEK AHEAD — EVENTS CALENDAR
Monday, March 23 — Trump–Iran 48-hour ultimatum response window closes.
Tuesday, March 24 — 2-Year Treasury Note auction. Richmond Fed Manufacturing Index (prior: −4).
Wednesday, March 25 — 2-Year FRN and 5-Year Treasury Note auctions (~$50B combined). House Financial Services Committee tokenization hearing. FHFA House Price Index.
Thursday, March 26 — Initial Jobless Claims (prior: 213K, consensus: 211K) | Continuing Claims (prior: 1,851K, consensus: 1,860K). 7-Year Treasury Note auction. Dallas Fed Manufacturing Survey.
Friday, March 27 — $14.16 billion in BTC options expire on Deribit. Max pain: $74,000–$75,000 (spot ~$66,500).
What to Watch for Dominance: The Iran situation remains the dominant binary: de-escalation triggers a stablecoin-to-risk rotation that would send USDTDOM lower and allow BTCDOM to press toward the 58.50% range, while escalation sustains the safe-haven bid and drives Tether Dominance through 8.00%. The secondary catalyst is the options expiry on Friday, not a macro data print this week, since both PCE and the Q4 GDP revision are pushed to April 9. The $14.16B expiry is large enough to move spot BTC by several percent in a single session, which mechanically affects every dominance ratio in the complex. The Treasury auction calendar adds a third variable: $100B+ in sovereign issuance during a geopolitically elevated week tightens dollar liquidity at the margin, a headwind for risk assets that tends to benefit USDTDOM even when crypto sentiment is neutral. Watch whether the tokenization hearing on Wednesday generates any institutional ETH flow signal; the BlackRock staked ETH ETF is live on Nasdaq and any legislative tailwind to the RWA thesis could produce a brief, isolated bid in Ethereum Dominance independent of the broader risk-off tone.
6. CLOSING REMARK
The dominance charts handed down a clear verdict this week: for the first time in this cycle, all four tracked risk assets lost market share simultaneously while a single safe-haven asset captured the entire gain. Tether Dominance’s 5.63% weekly surge against BTCDOM’s 1.66% decline is not a nuanced signal requiring interpretation. It is a direct statement that capital is retreating to safety within the ecosystem, not deploying into opportunity.
What makes this moment analytically interesting is what sits beneath that fear trade. The stablecoin market cap just reached $315.5 billion, an all-time high. BTC exchange reserves are at 7-year lows. Institutional ETF flows have remained positive for four consecutive weeks. The SEC just removed the securities classification overhang from the major L1s. The ingredients for a sharp reversal are accumulating in the background while the headline data registers maximum fear. The Fear & Greed Index at 10 is an extreme reading — and extreme readings do not last. The dominance matrix will signal the turn before price does. When USDTDOM breaks back below 7.50%, the rotation into risk will be swift and decisive. That level is the line to watch.
This content is produced by domination.finance for informational and educational purposes only. Nothing contained herein constitutes financial or investment advice. Always conduct your own research.