Dominance Debrief #26
The crypto market fell 3.95% and Ethereum Dominance rose 2.65% anyway. Tether Dominance rose 3.53%, the largest move of the week in either direction. BTCDOM, BNBDOM and SOLDOM all lost ground, down 0.44%, 1.35% and 2.18%.
THE DOMINANCE DEBRIEF
Week of September 7 – September 13, 2026
Issue #26
The crypto market fell 3.95% and Ethereum Dominance rose 2.65% anyway. Tether Dominance rose 3.53%, the largest move of the week in either direction. BTCDOM, BNBDOM and SOLDOM all lost ground, down 0.44%, 1.35% and 2.18%.
1. THE WEEK IN DOMINANCE
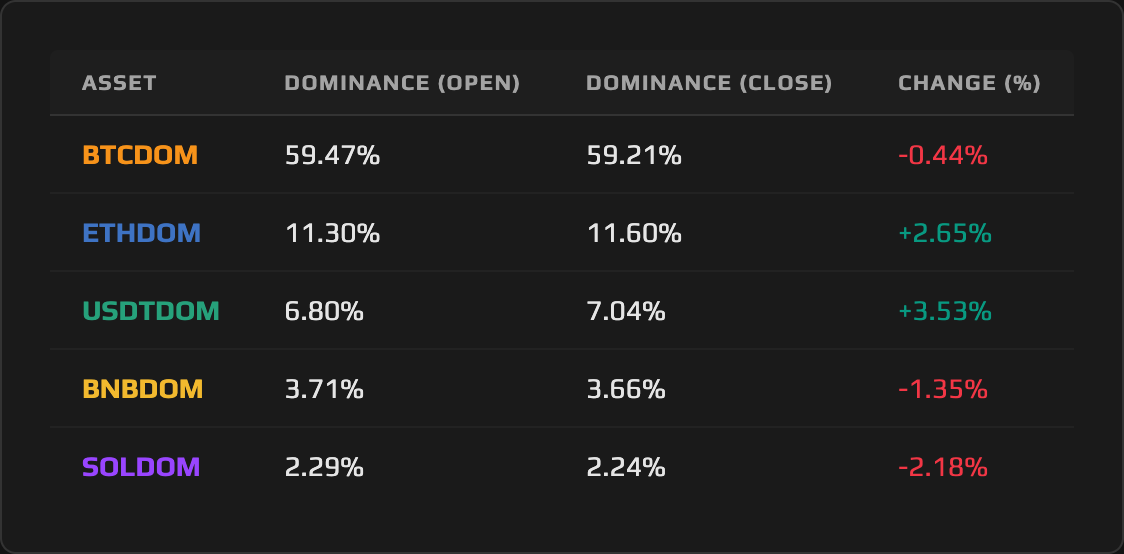
The total crypto market contracted 3.95% this week, from roughly $2.71 trillion to roughly $2.61 trillion, and dominance sorted itself by who fell slowest. Ethereum Dominance rose 2.65% even as Ether’s own price fell 1.48%, the one pair here that gained on a losing asset. USDTDOM rose 3.53%, the only other pair to close the week higher. Bitcoin Dominance slipped 0.44%, BNB Dominance fell 1.35%, and Solana Dominance fell 2.18%, the steepest decline of the week, as Solana’s own price fell faster than the market, down 6.73%.
2. MACRO CONTEXT — THE BACKDROP
Monday through Thursday the market bled with no single headline behind it. Bitcoin slid from $80,329 to $76,555 by Friday morning, a grind rather than a shock, and spot Bitcoin ETFs logged about $462.73 million of net outflows across September 8 to 11, four consecutive days of redemptions after an August that had pulled in roughly $3.52 billion.
Friday, September 11 changed the shape of the week. The August CPI print landed at 12:30 UTC in line with projections, headline up 0.4% on the month and 3.4% over the year, core up 0.3%, gasoline alone responsible for more than a third of the monthly gain. The whole risk complex repriced higher on the release, and roughly $266.5 million of short positions were liquidated across crypto derivatives inside the following hour. Ether ran from $2,433 to $2,667 in that session, a swing of more than 9.6%, before giving most of it back into the weekend. The rest of the week was a fade: sentiment cooled from a Fear and Greed reading of 71 on September 7 to 61 by September 13, Greed holding at both ends even as the tape softened underneath it.
This was a contraction week, and every dominance outcome below has to be read against that 3.95% decline. Standing still was enough to gain share; only assets that fell faster than the market itself actually lost ground.
3. ASSET DEEP DIVE
Ethereum (ETH) Dominance
Open: 11.30% · Close: 11.60% · WoW: +2.65%
The Structure
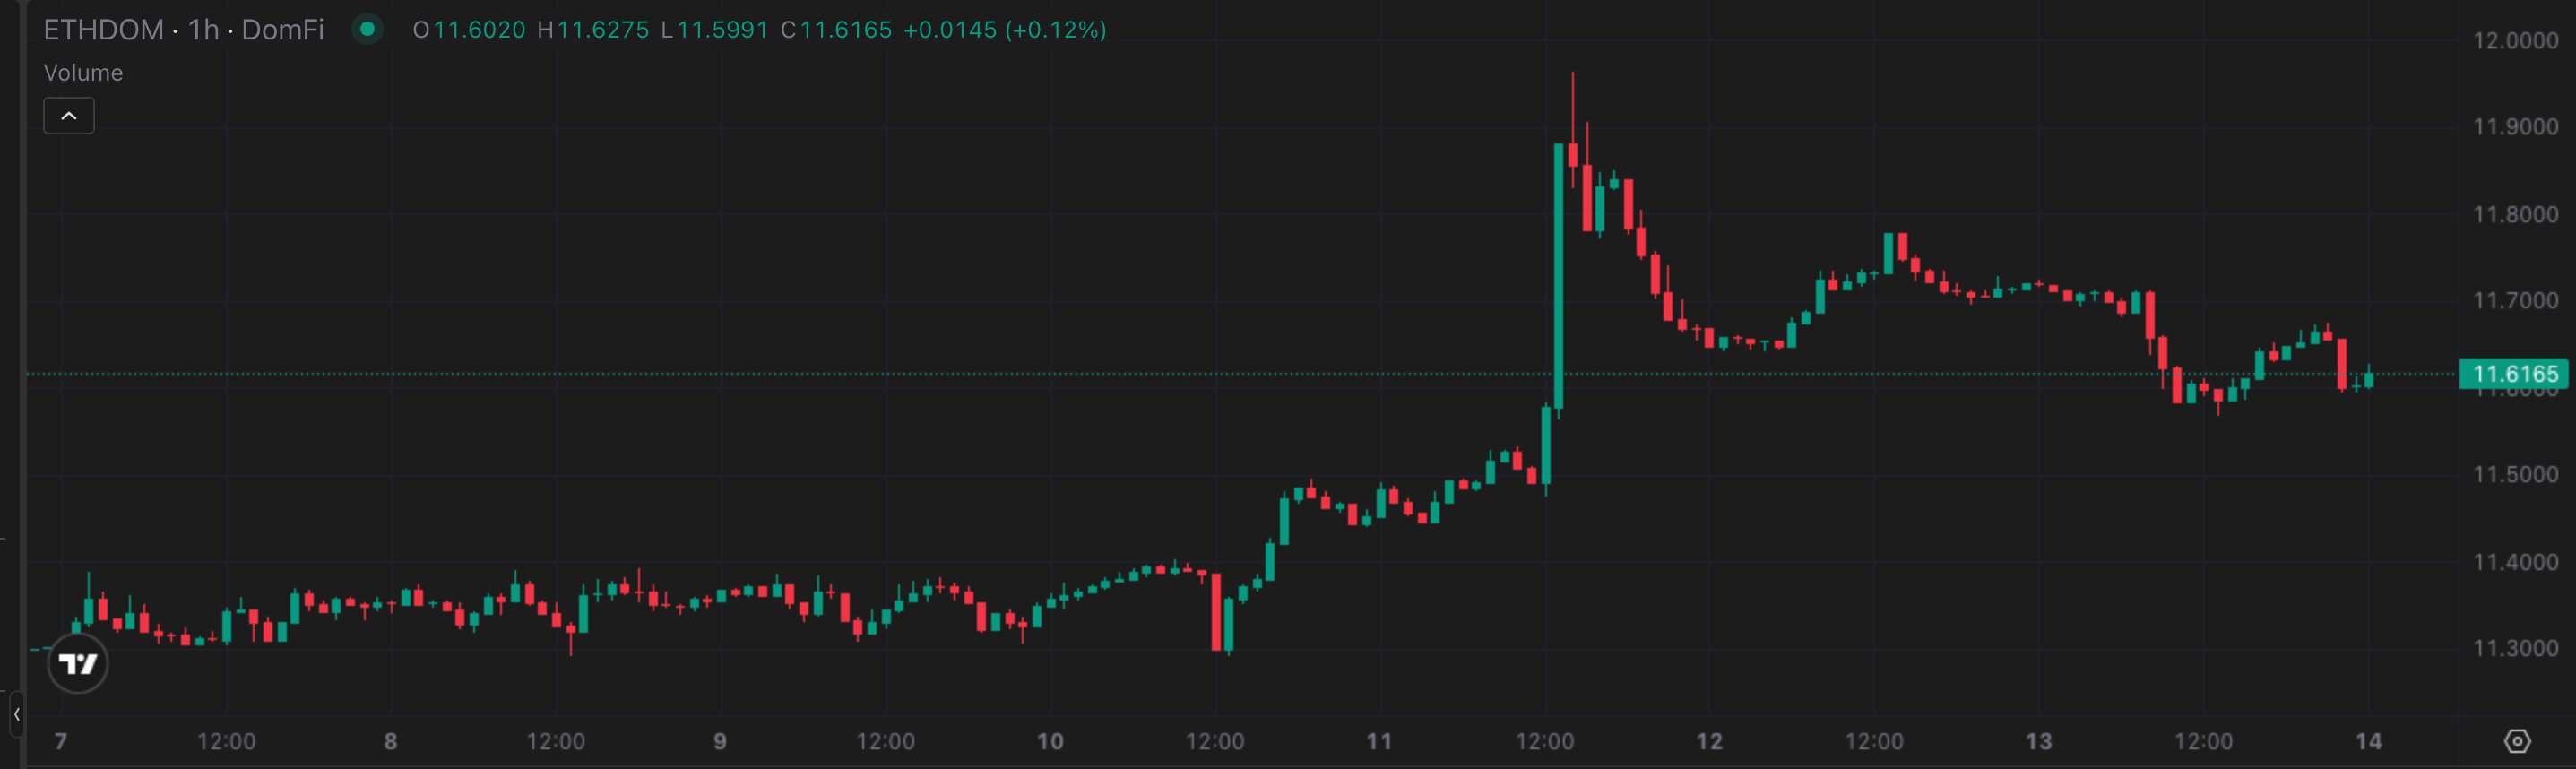
Ethereum Dominance held a band between roughly 10.32% and 10.60% from August 1 through August 18, then broke it in a single session on August 19, opening at 10.53%, reaching 11.73% and closing at 11.52%. From August 19 through September 10, ETHDOM held a range of roughly 11.11% to 11.73%, with daily closes mostly clustered between 11.2% and 11.5%. Friday’s advance cleared 11.73%, the level that has capped every session since the August 19 breakout, and pushed to 11.96%. The weekly close at 11.60% landed back inside the range. That is a test of 11.73%, not a reclaim of it, and the distinction matters going into next week.
This Week’s Price Action
Monday through Wednesday went nowhere, holding inside a narrow band between 11.30% and 11.40%. Thursday carried ETHDOM to an 11.45% daily close, a step higher ahead of what was coming. Friday did the rest of the work in two hours: ETHDOM ran from 11.49% to an 11.96% high before settling the day well above where it started. Saturday’s close at 11.72% was the strongest of the run, and Sunday gave back ground to finish the week at 11.60%.
The Daily View
The daily closes read 11.35%, 11.36%, 11.35%, 11.45%, 11.67%, 11.72% and 11.60%, Monday through Sunday. Three days pinned inside a hundredth of a percent of each other, then a step to 11.45%, then Friday’s break to 11.67%, then Saturday holding nearly all of it before Sunday eased off. Nearly the entire week’s gain sits inside Friday’s session, and the two days after it tell the more interesting part of the story: Saturday held almost all of the advance, and Sunday’s retreat pulled ETHDOM back toward the top of the band it had been building since August rather than erasing the move outright. The pair is testing resistance at the top of its own recent structure, not collapsing away from it.
The Why
Two mechanisms did the work here, and both need naming directly. The first is relative resilience: Ether fell 1.48% in a market that fell 3.95%, and an asset that loses less than the market gains dominance without a single dollar of net buying. That mechanism alone explains part of the move, but not the size of it, and not why the gain concentrated the way it did.
The second mechanism is genuinely Ether-specific. Friday’s CPI-driven repricing forced $307.48 million of short positions to cover in Ether alone over the following 24 hours, ahead of Bitcoin’s $211.50 million, meaning the short book unwinding hardest was concentrated in Ether rather than spread evenly across the complex. Flows lined up the same way: US spot Ether ETFs took in $216.4 million on September 11, with BlackRock’s ETHA responsible for $148.8 million of it, the third consecutive week of net inflows for the category. Spot Bitcoin ETFs recorded a $13.29 million outflow that same day, their fourth straight session in the red. Same release, same hour, opposite direction of flow, and Ethereum Dominance is where that divergence shows up on the chart.
The CPI print is the timing, not the cause. A release that reprices the entire risk complex at once cannot explain why one pair gained market share against the others; the concentration of short covering and ETF inflow specifically in Ether is what turned a market-wide event into an asset-specific dominance move.
The Outlook
11.73% is the level a continuation needs to close above; 11.96% is the week’s high sitting just past it. Below, 11.29% is the week’s low, and 11.11% is the support underneath that, the base the August advance built from. Wednesday’s FOMC decision is the calendar risk standing in front of this call. Lean toward continuation: the flow case built across three straight weeks of ETF inflows rather than firing in a single session, which is the more durable kind of setup. That lean stays conditional. The weekly close settling back beneath 11.73% says the level has not been taken yet, and a close below 11.29% would say the test failed rather than merely paused.
Trade ETHDOM: https://app.domination.finance/ETHDOM
4. THE DOMINANCE MATRIX
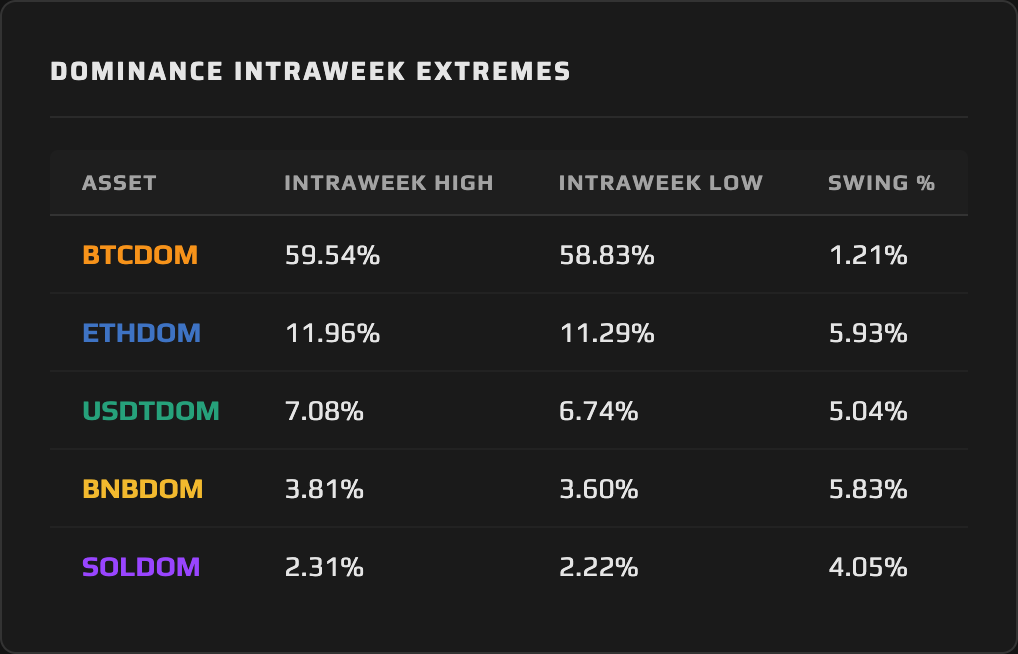
Ranked by size, this week splits into one gainer and three losers of very different depth: Tether Dominance up 3.53%, Solana Dominance down 2.18%, BNB Dominance down 1.35%, Bitcoin Dominance down 0.44%. The pair that gained the most is the one that does not rise by design, and that fact alone is the shape worth leading on.
Tether Dominance is the sharpest observation on the table, and it is not a flight-to-safety story. USDTDOM opened the week at 6.80% and closed at 7.04%, up 3.53%, the only gain besides Ethereum Dominance’s. Its daily closes read 6.85%, 6.87%, 6.91%, 7.06%, 6.97%, 6.98% and 7.04% across the week, and that shape says the week’s gain was already banked by Thursday, before Friday’s CPI print ever landed. The pair’s 7.08% high and 6.74% low, a 5.04% swing, printed within two hours of each other that Friday, the high in the 12:00 UTC hour and the low in the 14:00 hour, the same window that carried Ethereum Dominance to its 11.96% high, the cleanest cross-pair read in this issue. Friday’s move was a round trip, a rise into the noon hour and a fall back out of it two hours later. Nobody reached for cash.
Bitcoin Dominance did the least of any pair and says the most about the week’s texture. Its 1.21% swing, between a 58.83% low and a 59.54% high, is the narrowest reading on the extremes table, and Bitcoin’s price fell 4.37% against a market that fell 3.95%. That is a pair losing ground by falling slightly faster than the thing measuring it, a very different claim from capital rotating out of it. A week that opened at 59.47% and closed at 59.21% spent the whole stretch in between inside a band barely three-quarters of a percent wide.
Solana Dominance and BNB Dominance both lost ground, and they arrived at their losses through different depths of the same mechanism. Solana’s price fell 6.73%, the steepest decline of any asset here, and SOLDOM’s 2.18% loss follows from it almost directly; the pair’s high printed Monday at 2.31% and its low came Friday at 2.22%. BNB fell 4.84% in price, two-thirds as deep as Solana’s decline, yet BNBDOM lost only 1.35%, less than half of Solana’s dominance loss. BNBDOM’s high came Tuesday at 3.81% and its low Thursday at 3.60%, a 5.83% swing that covered nearly as much ground as ETHDOM did this week while ending on the opposite side of the line. Last week BNB Dominance was the biggest gainer on this table; this week it surrendered part of that advance.
Synthesis: this was a contracting market where share went to whoever declined slowest, with one genuine session of rotation into Ether sitting inside an otherwise mechanical week.
5. THE WEEK AHEAD — EVENTS CALENDAR
Monday, September 14 — Zcash NU7 coinholder and ZCAP polls close, 19:00 UTC (Ballot: five questions covering the ZEC issuance curve and halving schedule) | Solana Alpenglow migration expands toward 25% of stake
Tuesday, September 15 — Senate cloture vote on the CLARITY Act, 18:15 UTC (Threshold: 60 votes | Republican seats: 53) | Pi Network Protocol 27 mainnet activation
Wednesday, September 16 — FOMC rate decision and Summary of Economic Projections (Consensus: hike to 3.75%–4.00% | Prior: 3.50%–3.75%)
Friday, September 18 — Bank of Japan rate decision (Consensus: hike to 1.25% | Prior: 1.00%)
What to Watch for Dominance: Wednesday’s FOMC decision is the event that reprices every pair at once; the CLARITY Act cloture vote is the one that could move them differently from each other, since a favorable regulatory outcome tends to concentrate in specific assets rather than lift the whole complex evenly. ETHDOM enters the week testing 11.73%, with 11.29% the mark that would void it, and Bitcoin Dominance enters at 59.21%, sitting between a 58.83% low and a 59.54% high, the tightest band on the table and the first pair likely to signal which way the market is leaning.
6. CLOSING REMARK
An asset can lose value and still gain market share in the same week, and Ethereum did exactly that: down 1.48% in price, up 2.65% in dominance, on a market that fell more than twice as fast. That gap between price and share is the whole lesson of this issue, and it is why the dominance lens exists in the first place.
Two things carry into next week: whether ETHDOM closes above 11.73% and confirms the test, and what Wednesday’s FOMC decision does to the pace every pair here was measured against.
- Trade on DomFi: https://app.domination.finance/
- Deposit USDC into the Vault: https://app.domination.finance/vault
- Make a Referral Code: https://app.domination.finance/referrals
- Join our Discord: https://discord.com/invite/6wG5cdNSbM
This content is produced by domination.finance for informational and educational purposes only. Nothing contained herein constitutes financial or investment advice. Always conduct your own research.