Dominance Debrief #17
SOLDOM led dominance losses at -4.63% as SOL-specific selling accelerated. ETHDOM led gains at +1.73% on real demand. USDTDOM barely moved (+0.59%): this was not risk-off, just quality concentration inside crypto risk.
THE DOMINANCE DEBRIEF
Week of July 6 – July 12, 2026
Issue #17
TL;DR: SOLDOM led dominance losses at -4.63% as SOL-specific selling accelerated. ETHDOM led gains at +1.73% on real demand. USDTDOM barely moved (+0.59%): this was not risk-off, just quality concentration inside crypto risk.
1. THE WEEK IN DOMINANCE
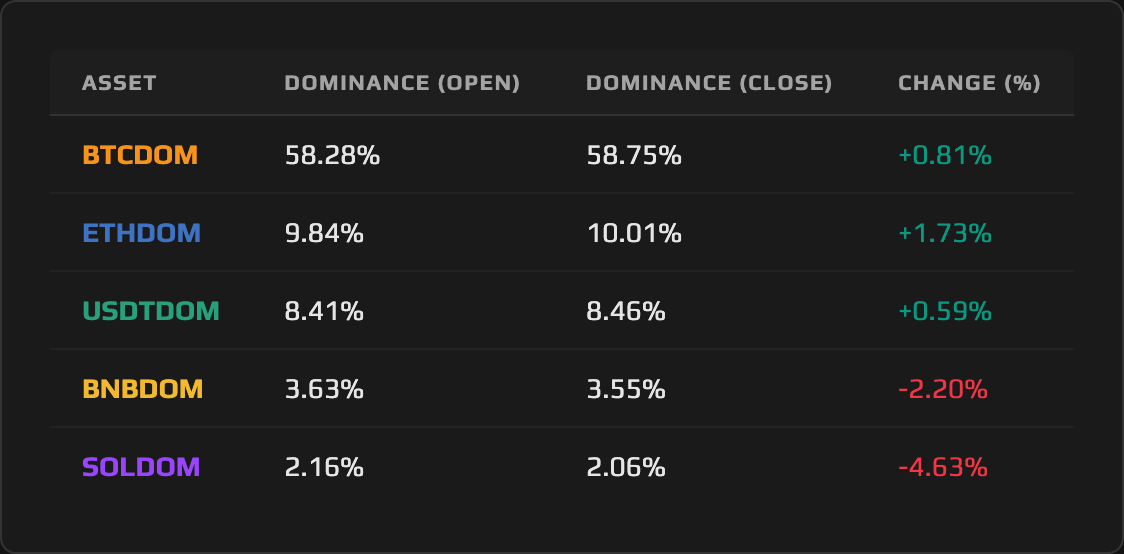
The dominance charts drew a clean line through the market this week: Bitcoin Dominance and Ethereum Dominance both gained ground while Solana Dominance and BNB Dominance both lost it, and Tether Dominance sat still enough to rule out a safety trade, which means capital moved up the quality curve inside crypto risk rather than out of it.
2. MACRO CONTEXT — THE BACKDROP
Total crypto market capitalization held roughly flat this week, easing from approximately $2.19 trillion to $2.18 trillion, a decline of about 0.6%. That stillness followed a violent prior week: BTC posted its best weekly performance since March, gaining roughly 7%, after a soft June jobs report (57K versus consensus above 100K) lowered the market’s odds of further Fed tightening. This week was digestion, not continuation, and the dominance data reads that way: nothing moved by the kind of magnitude that signals a fresh macro shock.
The inflation backdrop stayed hot enough to keep the market cautious. May CPI printed 4.2% year-over-year, the highest reading since April 2023, and that print now frames Tuesday’s June CPI release as the week ahead’s single highest-stakes catalyst. Layered against that, spot BTC and ETH ETFs turned a corner: the week of July 7–11 pulled in roughly $282 million in combined net inflows, ending an eight-week stretch that had bled approximately $9.46 billion. BTC funds absorbed about $197 million of that total and ETH funds about $84 million, with July 10 alone contributing $90.4 million to BTC funds and $18.4 million to ETH funds. Citi trimmed its 12-month price targets for both assets, citing slowing ETF inflows and stalled US crypto legislation, a reminder that the return of flows has not erased institutional caution. Fear & Greed sat in fear-to-neutral territory through the week, consistent with a market that stabilized without turning euphoric.
The overarching narrative is a selective one. Ethereum’s “Lean Ethereum” roadmap, unveiled this week, gave ETHDOM a genuine fundamental catalyst: recursive STARK-based verification, quantum resistance, multi-dimensional gas pricing, and a redesigned state model, all front-loaded into a single announcement that returning ETF demand could immediately trade against. That combination pulled capital toward Ethereum Dominance and, more broadly, toward the majors. What makes the week analytically distinct is what did not happen: Tether Dominance did not surge, USDT’s circulating supply held essentially flat near $184.3 billion, and the aggregate stablecoin market cap actually contracted slightly, from $310.0 billion to $308.7 billion. None of that is consistent with a flight to safety. If this were the deleveraging pattern that risk-off weeks produce, USDTDOM would have absorbed the outflows from the higher-beta pairs. Instead it barely moved, which means the capital that left SOLDOM and BNBDOM stayed inside crypto risk and simply repositioned into BTCDOM and ETHDOM.
3. ASSET DEEP DIVE
Solana (SOL) Dominance
Open Price: 2.16% / Close Price: 2.06% / WoW Change: -4.63%
The Structure
Solana Dominance enters this week already carrying the weight of a longer downtrend in the underlying asset. SOL closed its ninth consecutive red month heading into July and trades roughly 72% below its prior peak, a run of sustained weakness that has kept SOLDOM under structural pressure well before this week’s candle opened. Against that backdrop, the 2.16% open was already a level defended more by inertia than conviction, and the week’s price action tested that defense directly.
This Week’s Price Action
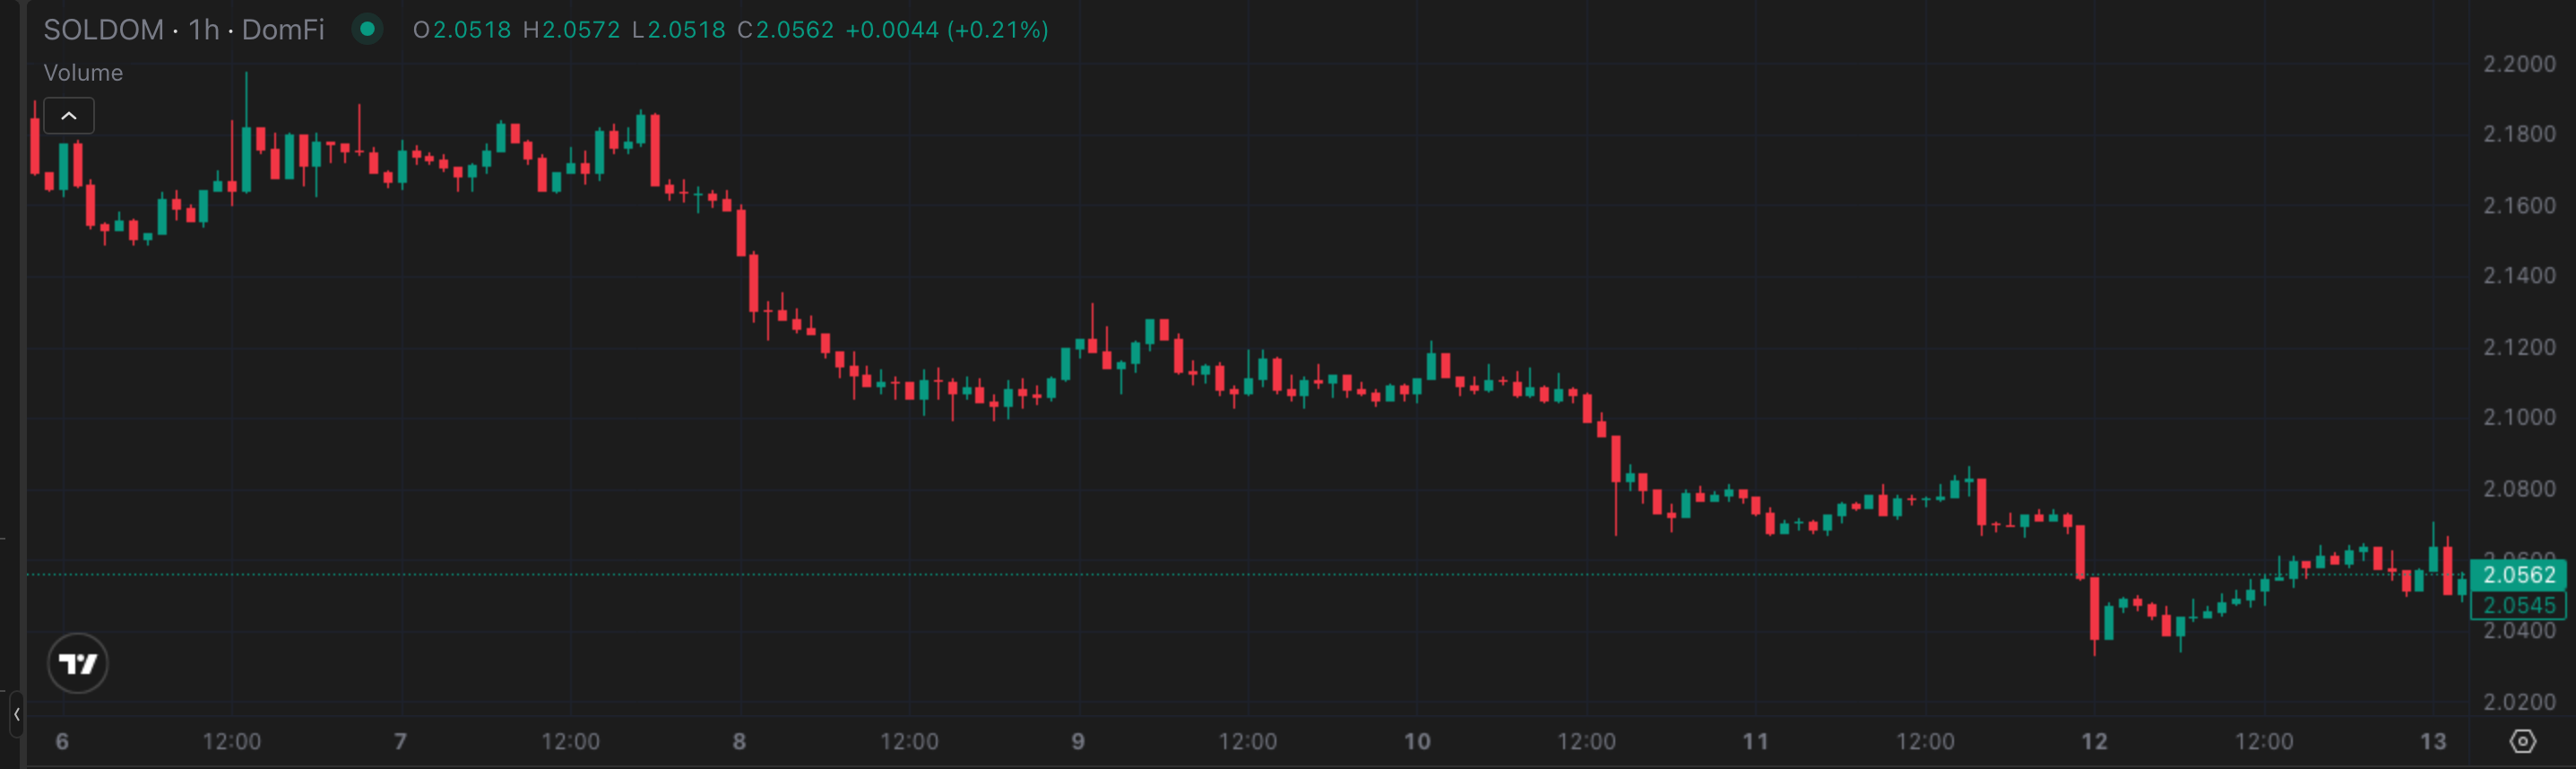
SOLDOM opened at 2.16% and pushed immediately higher, tagging the week’s 2.20% intraweek high early on, around Monday, July 6. That level was tested and rejected: dominance turned lower from there and never revisited it. The decline that followed was not a single sharp break but a steady grind, stepping SOLDOM down through the week to a 2.03% intraweek low around Friday, July 12, before closing at 2.06%. A 2.16% open giving way to a 2.06% close, with the failed high sitting at 2.20% and the intraweek floor at 2.03%, describes a week that opened with a bid and spent the remaining days unwinding it.
The Daily View
The daily shape confirms the weekly read rather than diverging from it. The early-week push toward 2.20% coincided with SOL price still holding above the $80 level; once that price support gave way, SOLDOM’s daily candles turned decisively negative and stayed there through the back half of the week. There is no daily divergence to flag here, no session where dominance held while price fell or vice versa. Price and dominance moved together, which is itself the signal: this was not a dominance-specific anomaly layered on top of stable price action, it was price weakness translating directly into share loss.
The Why
The mechanics behind the -4.63% move split into a genuine price-driven collapse with almost no offsetting support from the broader market. SOL’s price fell 5.61%, from $81.44 to $76.87, failing to hold the $80–85 resistance-turned-support band that had capped the prior attempt higher. That failure triggered a long-liquidation cascade specific to SOL: crowded leveraged positions built into the $80–85 zone were flushed as price broke below it, accelerating the slide beyond what spot selling alone would have produced. Whale wallets added to the pressure, moving roughly 600,000 SOL onto centralized exchanges over the days surrounding the week, a scale of deposit that elevates near-term sell-side supply regardless of what triggers the eventual selling.
Supply overhang compounded the demand-side weakness. Fourteen SOL-based tokens are unlocking through the month of July, and the PUMP unlock on July 12 alone released approximately $123 million, a 21.35% increase in PUMP’s circulating supply that drained secondary liquidity from across the Solana ecosystem at the same moment SOLDOM was posting its intraweek low. None of this happened against a rising total market: crypto market capitalization was roughly flat on the week, meaning SOLDOM’s compression traces almost entirely to SOL-specific selling rather than to the broader market expanding underneath it. This is a case where the usual dual-mechanism read collapses toward a single dominant driver: SOL lost ground because SOL was sold, not because everything else grew around it.
The Outlook
The bear case is straightforward and already in motion: the 2.20% level that was tested and rejected this week is now overhead resistance, the July unlock calendar keeps supply pressure elevated through month-end, and a hot June CPI print on Tuesday would extend the higher-for-longer regime that has already pressured SOL’s price for nine straight months. Under that path, SOLDOM presses toward and potentially through the 2.00% psychological level. The bull case requires SOL to reclaim the $80 price level convincingly, which would need either a cool CPI surprise that revives broad risk appetite or a slowdown in exchange deposits that signals the whale-driven selling has run its course. Absent one of those catalysts, the path of least resistance for Solana Dominance remains lower, with 2.00% as the level to watch and 2.20% as the level that would need to be reclaimed, not just tested, to change the structure.
4. THE DOMINANCE MATRIX
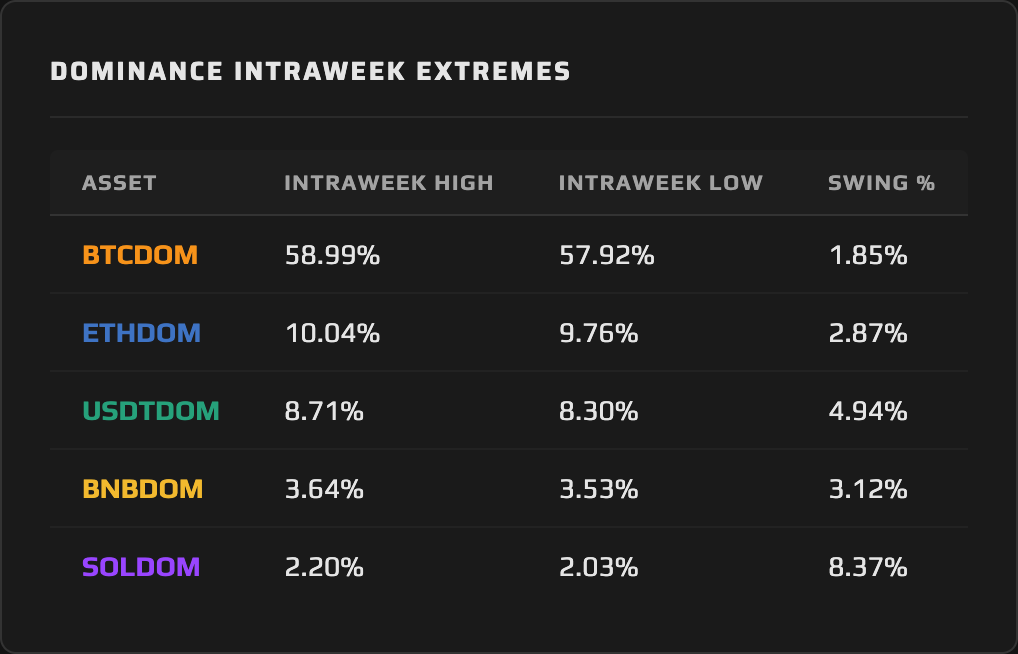
Ethereum Dominance led every pair this week at +1.73%, and the gain traces to real demand rather than passive share capture. The Lean Ethereum roadmap gave the market a concrete reason to own ETH exposure, ETF inflows into ETH funds ran roughly $84 million on the week, and ETH’s price rose 1.24%. That combination, a fundamental catalyst plus returning institutional flow plus a positive spot move, is what separates ETHDOM’s advance from a mechanical drift: capital rotated in, it did not simply arrive by default while other pairs shrank.
Bitcoin Dominance gained 0.81% despite BTC’s price moving almost nothing, up just 0.31%. BTCDOM’s advance is best read as the anchor holding while the higher-beta pairs bled: roughly $197 million in BTC ETF inflows provided a steady bid under the largest pair even as price barely budged, and with the total market essentially flat on the week, BTCDOM’s gain reflects share pulled from elsewhere in the complex rather than fresh market-wide growth lifting it.
Tether Dominance moved just 0.59%, and the size of that move matters as much as its direction. USDT’s circulating supply held essentially flat near $184.3 billion, and the aggregate stablecoin market cap actually contracted from $310.0 billion to $308.7 billion over the week. A genuine flight-to-safety week produces a USDTDOM surge on the scale of BTCDOM’s or ETHDOM’s move, not a fractional gain smaller than either. What USDTDOM’s tiny advance most likely reflects is the total market dipping slightly against a roughly flat USDT balance, a mechanical outcome rather than a defensive rotation. There is a sharper story sitting underneath that aggregate number, though: because the stablecoin category as a whole contracted while USDT specifically held its ground, USDT quietly gained share within the stablecoin complex itself, a dominance story within the dominance story that the aggregate figure alone does not show. That intra-category rotation is exactly the kind of depth the dominance lens is built to surface.
BNB Dominance was the week’s other decliner, down 2.20% as BNB’s price fell 2.58%, from $589 to $574. BNBDOM’s loss puts it in the same directional camp as SOLDOM, both higher-beta pairs bleeding share while the majors gained it, but the magnitude gap between BNBDOM’s 2.20% and SOLDOM’s 4.63% is itself informative: BNB absorbed the week’s rotation away from risk without the kind of unlock-driven, liquidation-amplified collapse that hit Solana specifically.
The sharpest read of the week sits in the ETHDOM-versus-BNBDOM contrast rather than in a simple gainers-versus-losers count. Both are large-cap alternatives to Bitcoin, both operate in the same competitive tier, and they finished the week on opposite sides of zero by a wide margin, +1.73% against -2.20%. That split proves the rotation was catalyst-driven and selective, not a blanket beta trade that lifted or sank every non-Bitcoin pair uniformly. The full dominance picture this week describes selective concentration up the quality curve within crypto risk, not a retreat from risk itself and not a broad rotation into every alternative pair. That regime holds until one of two things changes: USDTDOM breaking meaningfully higher, which would mark a genuine turn toward safety, or SOLDOM and BNBDOM beginning to reclaim share from BTCDOM and ETHDOM, which would mark a turn toward broad risk-on. Neither has happened yet.
5. THE WEEK AHEAD — EVENTS CALENDAR
Tuesday, July 14 — US June CPI, 8:30 ET (Consensus: ~4.0% YoY | Prior: 4.2% YoY).
Wednesday, July 15 — US June PPI, 8:30 ET (Prior: 6.5% YoY) | StarkNet (STRK) token unlock: approximately $3.90 million, 1.95% of circulating supply.
Thursday, July 16 — US June Retail Sales (Prior: +0.9% MoM) | Initial Jobless Claims (Prior: 215K) | Philadelphia Fed Manufacturing Index | Arbitrum (ARB) token unlock: approximately $8.94 million, 1.47% of circulating supply.
Friday, July 17 — US Housing Starts | University of Michigan Consumer Sentiment (preliminary) | Deribit weekly BTC and ETH options expiry.
What to Watch for Dominance: Tuesday’s June CPI print is the week’s highest-impact catalyst by a wide margin. A hot number above the 4.2% prior revives the higher-for-longer narrative and pressures the higher-beta pairs further, extending SOLDOM below 2.00% and BNBDOM lower while BTCDOM and USDTDOM firm as the market’s defensive posture within risk. A cool print extends the ETF-driven bid that carried BTCDOM and ETHDOM this week and could let SOLDOM stabilize above the 2.00% level it is currently testing from above. Watch Ethereum Dominance specifically: a hold above 10.00% while the smaller pairs continue to bleed would confirm that the quality-concentration regime is intact rather than a one-week anomaly.
6. CLOSING REMARK
The defining feature of this week’s dominance charts is not that Solana Dominance fell 4.63% or that Ethereum Dominance gained 1.73%. It is that Tether Dominance barely moved while both of those things happened. A market retreating from risk sends capital into USDTDOM; a market rotating within risk sends it toward the pairs with the clearest catalysts and leaves the stablecoin pair roughly where it started. This week produced the second pattern, cleanly enough that the absence of a USDTDOM move is as informative as the presence of the SOLDOM and ETHDOM ones.
That distinction matters for how the coming week should be read. A hot CPI print will not, by itself, prove the market has turned risk-off; it needs to show up as a genuine USDTDOM advance, not just further bleeding in SOLDOM and BNBDOM, before that conclusion is warranted. Until Tether Dominance moves with the same conviction the majors showed this week, the more accurate description of this market is not fear. It is selectivity.
This content is produced by domination.finance for informational and educational purposes only. Nothing contained herein constitutes financial or investment advice. Always conduct your own research.