Dominance Debrief #16
Risk-on returned. USDTDOM collapsed 7.58% as capital fled the sidelines, funding a rotation down the curve: ETHDOM +6.38%, SOLDOM +6.93%. BTCDOM sat dead flat at 58.27% — Bitcoin joined the rally but didn't lead it.
THE DOMINANCE DEBRIEF
Week of June 29 – July 5, 2026
Issue #16
TL;DR: Risk-on returned. USDTDOM collapsed 7.58% as capital fled the sidelines, funding a rotation down the curve: ETHDOM +6.38%, SOLDOM +6.93%. BTCDOM sat dead flat at 58.27% — Bitcoin joined the rally but didn’t lead it.
1. THE WEEK IN DOMINANCE
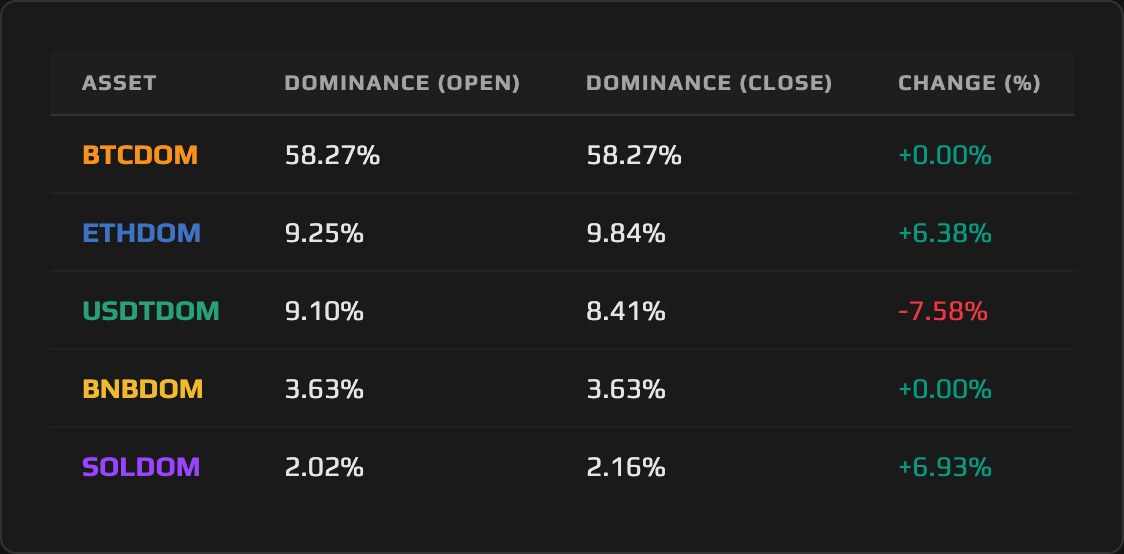
This week inverted the flight-to-safety playbook. Tether Dominance collapsed 7.58% as capital that had been parked on the sidelines rotated back into the risk curve, but it landed unevenly: Ethereum Dominance jumped 6.38% and Solana Dominance surged 6.93%, while Bitcoin Dominance and BNB Dominance both closed the week exactly where they opened. Capital left the stablecoin bid and moved into the higher-beta end of the complex; Bitcoin rode the rally in price but ceded no market share to fund it, and gained none either.
2. MACRO CONTEXT — THE BACKDROP
The total crypto market capitalization expanded from roughly $2.03 trillion at Monday’s open to approximately $2.17 trillion by Sunday’s close, a gain of about 6.8%. That expansion tracked Bitcoin’s price move almost tick for tick: BTC rose 6.77% on the week while Bitcoin Dominance did not move at all, meaning the total market grew in near lockstep with Bitcoin rather than through altcoins outrunning it broadly. The more interesting story sits underneath that headline number. This was not simply crypto going up. It was capital leaving the stablecoin complex and redeploying down the risk curve, specifically into Ethereum and Solana.
The catalysts arrived in sequence. Spot Bitcoin ETFs logged five consecutive days of net inflows this week, led by BlackRock’s IBIT, culminating in a $221.72 million net inflow on Friday, July 3, the largest single-day haul in nearly two months and the print that formally ended a ten-day outflow streak. That reversal matters against its backdrop: June had been an ugly month for the ETF complex, with $4.06 billion in net outflows, roughly three-quarters of it concentrated in IBIT alone. The Federal Reserve, now chaired by Kevin Warsh, held rates at its June meeting in a decision read as hawkish, and June nonfarm payrolls printed Thursday, July 2, against a May reading of +172K. The combination of a Fed hold that did not spook the market and a fast-reversing ETF flow picture gave risk appetite room to rebuild through the week rather than through any single dramatic catalyst.
The Crypto Fear & Greed Index opened the week mired in Fear, in the low-to-mid 20s after June’s washout, and clawed back toward Neutral by Sunday as the rally built. That improvement in sentiment lines up precisely with where the dominance capital moved: out of Tether Dominance, which had been the safety trade all quarter, and into Ethereum Dominance and Solana Dominance, the two highest-beta pairs in the complex. Bitcoin Dominance and BNB Dominance sitting dead flat is the detail that keeps this from being read as an indiscriminate risk-on sweep. This was a selective rotation down the curve, not a rising tide lifting every dominance pair equally.
3. ASSET DEEP DIVE
Ethereum (ETH) Dominance
Open Price: 9.25% / Close Price: 9.84% / WoW Change: +6.38%
The Structure
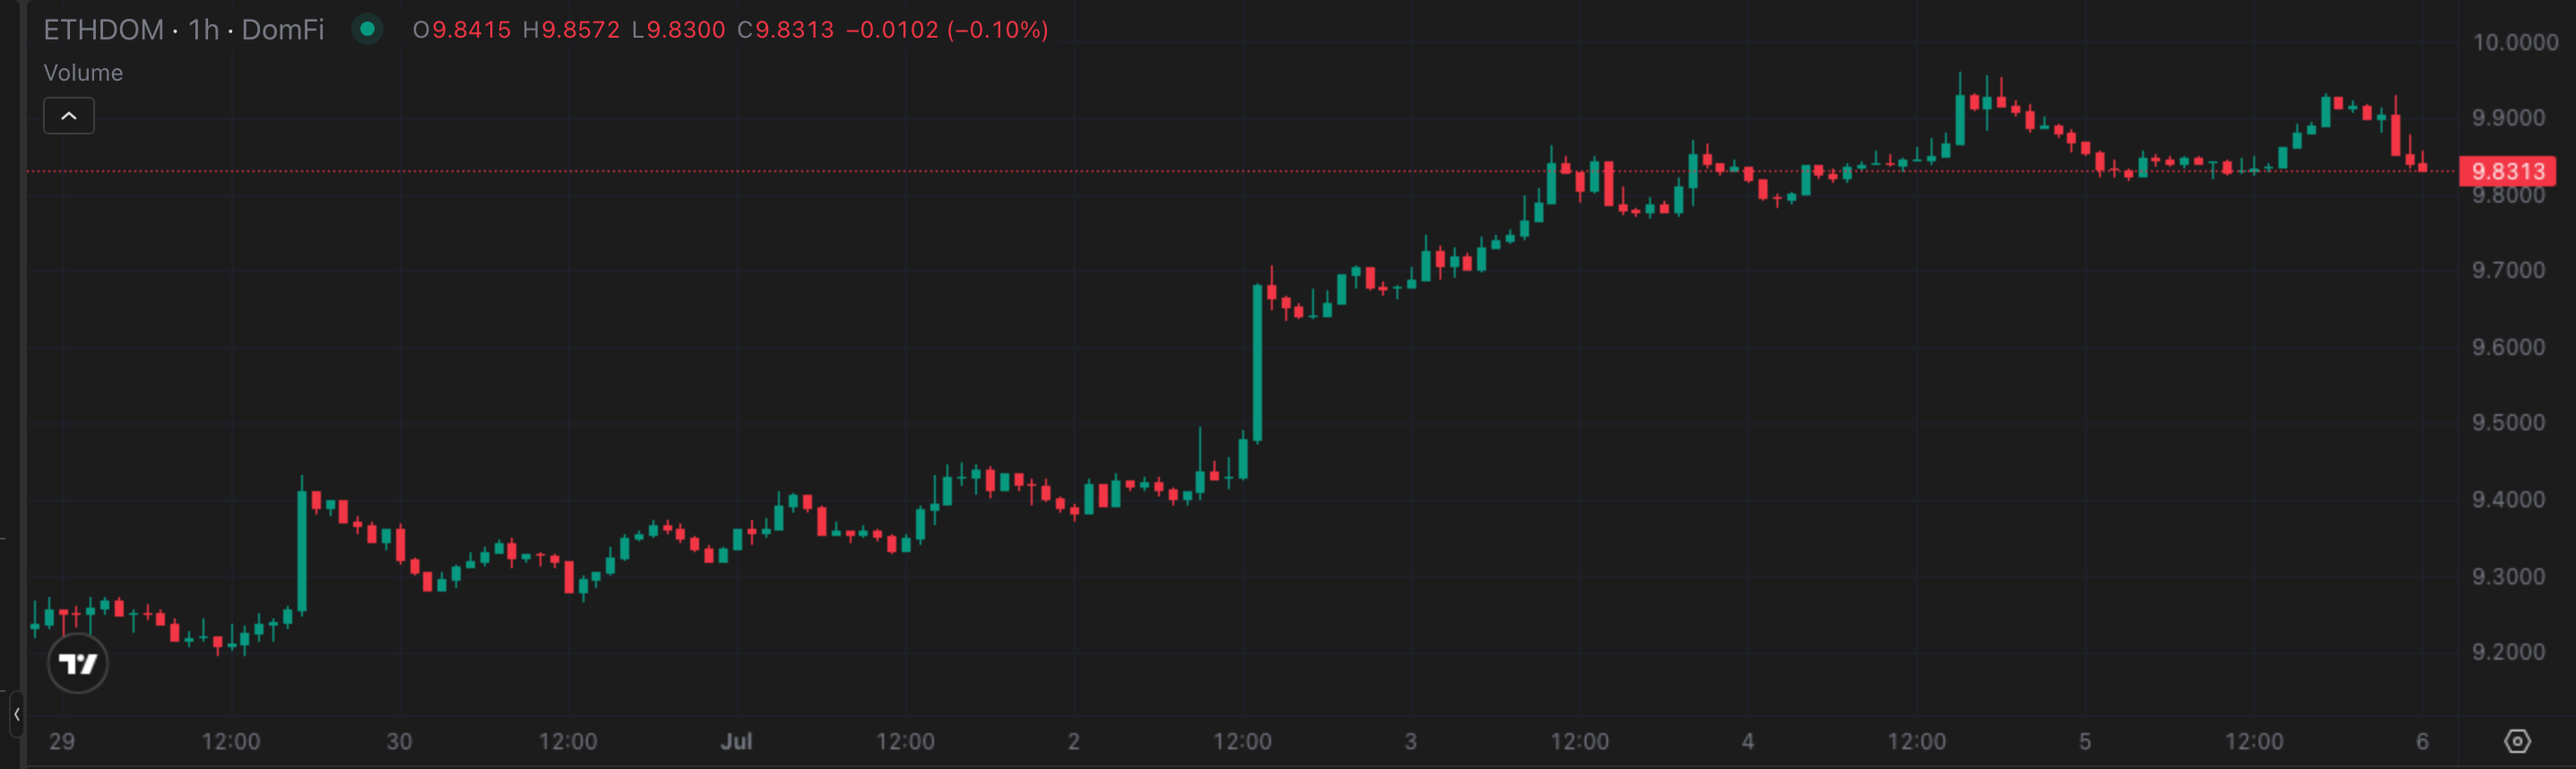
Ethereum Dominance spent the entirety of the second quarter in contraction. It opened April near 11.16%, and from there the weekly structure built a clean sequence of lower-highs and lower-lows, grinding down through May and into a floor in the low-9% region by late June, anchored around 9.20%. This week’s move from 9.25% to 9.84%, a gain of 6.38%, is the first weekly reversal of that entire quarter-long contraction. The overhead level to watch is 10.00%, reinforced by a shelf near 10.04% that capped ETHDOM in mid-May; a weekly close above it would be the first evidence that the Q2 downtrend has actually broken, not just paused.
This Week’s Price Action
ETHDOM opened at 9.25% and immediately tested the quarter’s floor, dipping to an intraweek low of 9.19%, a clean retest of the 9.20% base that had held since June. From there the reversal took hold: Ethereum Dominance ran to an intraweek high of 9.96%, just short of the 10.00% level, before settling into a 9.84% close. That is an 8.38% swing from low to high, the second-largest of any pair this week. The mechanism behind the close is specific: ETH’s price rose 13.55% on the week against Bitcoin’s 6.77%, so Ethereum Dominance rose because ETH outran the majors, not because the total market contracted around it. This was share gained through outperformance, not share gained by default.
The Daily View
The daily structure confirms the weekly reversal rather than complicating it. Momentum built through the middle of the week as two Ethereum-specific catalysts landed almost simultaneously: BlackRock’s staked Ethereum ETF drew $100 million on its first day, and “Ethereum Institutional” opened for business on July 1, positioned as a neutral front door for banks and asset managers entering the ecosystem. Both catalysts landed inside the same window that ETHDOM printed its intraweek high near 9.96%, and the pullback into the 9.84% close reads as digestion of that move rather than a rejection of it. There is no divergence to flag here; the daily tape and the weekly reversal are telling the same story.
The Why
Two mechanisms are doing the work here, and they need to be named separately. The first is Ethereum-specific institutional demand: the staked ETH ETF’s $100 million debut, the Ethereum Institutional launch opening bank and asset-manager rails directly onto the network, and SharpLink’s $16 million ETH purchase just ahead of the week all point capital directly at ETH rather than at the risk complex generally. The second mechanism is the broader rotation out of stablecoins: Tether Dominance’s 7.58% decline released capital that had been sitting on the sidelines, and that capital lifted the entire risk complex, ETH included. Ethereum Dominance’s 6.38% gain is a significant factor of both forces operating together; the second alone would not have been enough to produce a move this large. Solana Dominance also rose sharply this week, up 6.93%, on RWA and stablecoin-supply momentum, but the character of that bid is different. SOLDOM’s move is high-beta and narrative-driven, momentum chasing a $3.4 billion RWA TVL record and on-chain stablecoin supply above $16 billion. ETHDOM’s move, by contrast, is structural and institutional: an ETF product and a named institutional on-ramp pulling in allocator-grade capital. Same rotation, same week, a different quality of capital underneath it.
The Outlook
The bull case is direct: a weekly close back above 10.00% confirms the reversal is structural rather than a single bounce, and opens room toward the 10.50% area ETHDOM last traded near earlier in the quarter. That case needs two things to hold: a dovish read on Wednesday’s FOMC minutes, and continuation in the ETF inflow data that just turned positive. The bear case is just as specific: 9.84% is one reversal candle sitting inside a quarter that spent three months contracting, and a rejection at 10.00% followed by a slip back under the 9.20% floor would negate the move entirely and hand the bid straight back to Tether Dominance. Both levels, 9.20% below and 10.00% above, are the ones that matter. Everything else is noise until one of them breaks.
4. THE DOMINANCE MATRIX
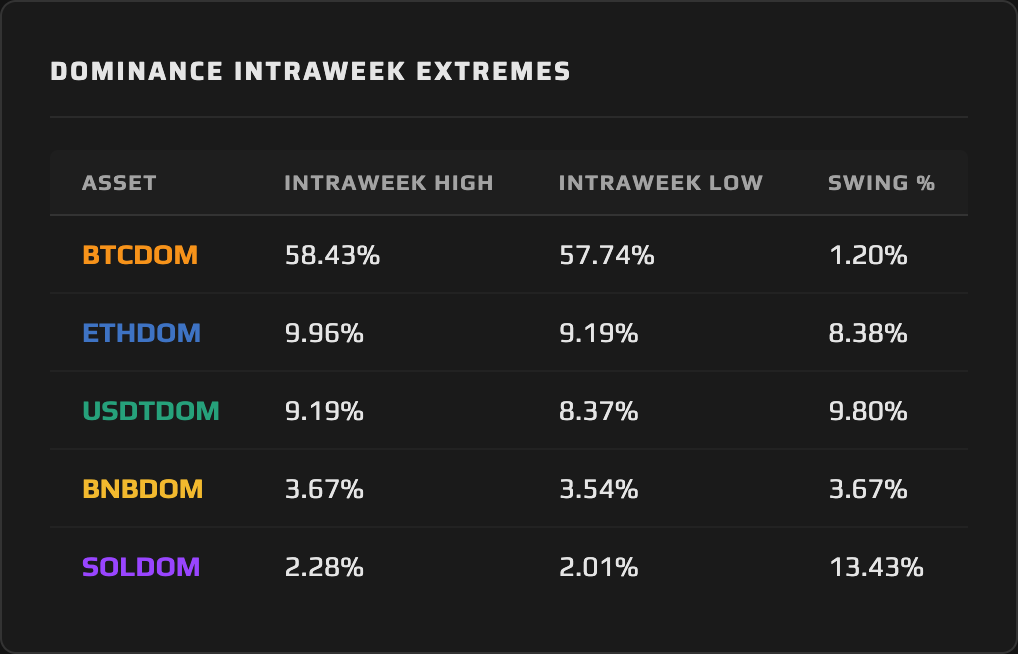
Tether Dominance’s collapse is the spine of this week’s dominance picture, and it needs to be read as the source of the rotation rather than one node sharing a narrative with the assets that gained. USDTDOM fell 7.58%, from 9.10% to 8.41%, the mirror image of the climb it built across the entirety of the second quarter. Two mechanisms drove it, and they compound rather than substitute for each other: the total crypto market cap expanded roughly 6.8% this week while the aggregate stablecoin market cap, at approximately $311.2 billion to $309.4 billion, held essentially flat to slightly lower. A market that grows around a static-to-shrinking stablecoin float squeezes Tether Dominance from both sides at once. The extremes table adds the volatility context: USDTDOM’s 9.80% intraweek swing, from a 9.19% high down to an 8.37% low, was among the sharpest directional moves of the week.
That capital did not distribute evenly. Solana Dominance was the week’s clearest destination, rising 6.93% from 2.02% to 2.16% on the back of the best price performance of any tracked asset: SOL rose 14.19% against Bitcoin’s 6.77% and Ethereum’s 13.55%. The fundamentals lined up behind the price. Solana’s real-world-asset TVL hit a record $3.4 billion on July 2, and on-chain stablecoin supply on the network surpassed $16 billion, both signals of genuine on-chain activity rather than a pure momentum chase. SOLDOM also carried the widest intraweek swing of any pair this week at 13.43%, running from a 2.01% low to a 2.28% high. That combination, the largest swing paired with the largest weekly gain, marks Solana Dominance as the highest-beta expression of this week’s risk appetite.
Bitcoin Dominance and BNB Dominance sit on the other side of the ledger entirely, and their flatness is not a null result; it is the tell. Bitcoin’s price rose 6.77% this week, essentially the same rate as the total market’s 6.8% expansion, which is exactly why BTCDOM closed at 58.27%, unchanged from where it opened. Capital rotated through Bitcoin rather than concentrating in it: Bitcoin absorbed the ETF inflows and moved with the tape, but it did not capture incremental market share the way Ethereum and Solana did. BTCDOM was also the calmest pair on the board, with an intraweek swing of just 1.20% between a 57.74% low and a 58.43% high. A flat Bitcoin Dominance reading during a week when two other pairs are each swinging more than 6% is a textbook signal of early-stage rotation: the market is not yet concentrating gains in the largest asset, it is spreading them further out the risk curve.
BNB Dominance told a quieter version of the same story. BNB’s price rose 7.03%, close enough to the broader market’s advance that BNBDOM closed exactly where it opened, at 3.63%. BNB Dominance neither led this rotation nor bled from it; it tracked the market and sat the week out.
Synthesis: the dominance picture this week describes a selective risk-on rotation down the curve: capital left the stablecoin complex and moved into the higher-beta pairs, Ethereum Dominance and Solana Dominance, while Bitcoin Dominance and BNB Dominance merely tracked the total market’s advance. The rotation is real, but it is not yet broad, and it only becomes a durable shift in market leadership if Ethereum Dominance reclaims 10.00% and Bitcoin Dominance actually begins ceding share rather than holding flat.
5. THE WEEK AHEAD — EVENTS CALENDAR
Monday, July 6 — Hyperliquid (HYPE) token unlock: 9.92M HYPE (~$708.69M), approximately 1.0% of total supply, released to core contributors | S&P Global US Services PMI Final (Consensus: ~51.3 | Prior: 51.3) | S&P Global US Composite PMI Final (Consensus: ~52.2 | Prior: 52.2)
Tuesday, July 7 — 3-Year Treasury Note auction (~$58 billion)
Wednesday, July 8 — FOMC Minutes from the June 16–17 meeting (2:00 PM ET) | 10-Year Treasury Note auction (~$42 billion) | Wholesale Inventories, May final (Consensus: 0.3% | Prior: 0.3%) | Consumer Credit, May (Consensus: ~$17.5 billion | Prior: ~$17.9 billion)
Thursday, July 9 — Initial Jobless Claims (Consensus: 219K | Prior: 221K) | Continuing Claims (Prior: ~1.96 million) | 30-Year Bond auction (~$25 billion)
Sunday, July 12 — Pump.fun (PUMP) token unlock: 82.5B PUMP (~$116.70 million), approximately 23.31% of circulating supply
What to Watch for Dominance: Wednesday’s release of the June 16–17 FOMC minutes is the highest-impact catalyst on the board. A dovish read extends this week’s rotation and presses Tether Dominance toward the 8.30–8.37% support zone defined by this week’s low, while Ethereum Dominance tests the 10.00% level and Solana Dominance pushes back toward its 2.28% high. A hawkish read does the opposite: it revives the stablecoin bid and pushes USDTDOM back toward 8.60% or higher, stalling the reversal in both ETHDOM and SOLDOM before either can confirm a break of its overhead level.
6. CLOSING REMARK
Through the spring and into early summer, Tether Dominance climbed while Ethereum Dominance bled, a slow and consistent expression of capital sitting on the sidelines rather than deploying into the risk complex. This week both trends reversed in the same seven days, and did so together: Tether Dominance’s sharpest weekly contraction of the quarter landed in the identical window as Ethereum Dominance’s first weekly reversal since the contraction began. Two dominance pairs snapping in opposite directions on the same catalysts, in the same week, is the cleanest signal the dominance charts have produced all quarter.
It is still one week. Bitcoin Dominance held dead flat at 58.27%, which means the rotation has not broadened into genuine altcoin leadership; it has simply redirected fresh capital toward Ethereum and Solana while Bitcoin rode along without ceding or gaining ground. And at 8.41%, Tether Dominance still sits well above the roughly 7.4% base it traded from back in April, which means meaningful capital remains parked on the sidelines if this rotation is going to extend rather than stall. The line to watch from here is whether Ethereum Dominance can close a week back above 10.00%. That is the level that turns a single reversal candle into a confirmed trend change, and until it breaks, the quarter’s dominant story, stablecoins gaining share while Ethereum bled it, remains only paused, not reversed.
This content is produced by domination.finance for informational and educational purposes only. Nothing contained herein constitutes financial or investment advice. Always conduct your own research.