Dominance Debrief #15
ETHDOM fell −2.94% to 9.26%, resuming its two-month slide and sold harder than any major. USDTDOM surged +5.46% to 9.08% as the safety bid ran to cash, not BTCDOM. SOLDOM cleared 2.00%.
THE DOMINANCE DEBRIEF
Week of June 22 – June 28, 2026
Issue #15
TL;DR: ETHDOM fell −2.94% to 9.26%, resuming its two-month slide and sold harder than any major. USDTDOM surged +5.46% to 9.08% as the safety bid ran to cash, not BTCDOM. SOLDOM cleared 2.00%.
1. THE WEEK IN DOMINANCE
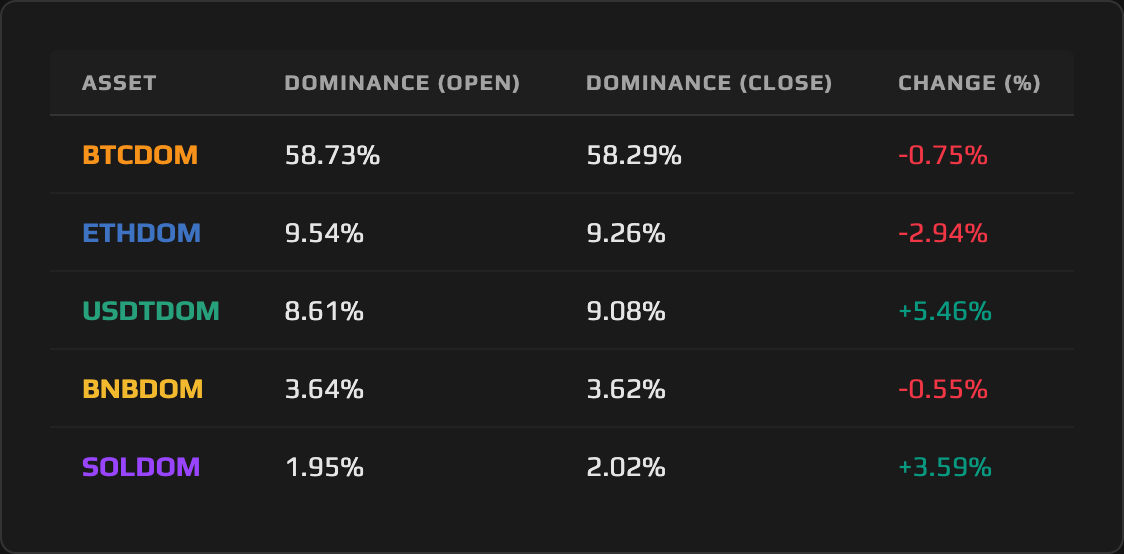
The total crypto market contracted roughly $110 billion across the week, from approximately $2.14 trillion to $2.03 trillion, and the dominance charts told a story of sharp divergence: Ethereum losing its footing entirely, Tether absorbing the fear, and Solana holding value well enough to quietly take ground. Bitcoin and BNB tracked the tape. The safety bid this week went to cash, not to BTC.
2. MACRO CONTEXT — THE BACKDROP
The inflection point arrived Thursday, June 25, when May core PCE printed at +3.4% year-over-year, the highest reading since October 2023, with a +0.3% month-over-month increase. Headline PCE came in at +4.1% year-over-year, the highest since April 2023, up from April’s +3.3% prior. The data killed near-term rate-cut hopes outright. Coming into the week, Chair Warsh’s debut the prior week had already stripped the easing bias from Fed guidance, and Bank of America on June 22 flipped to forecasting three 2026 hikes toward a 4.25–4.5% target. The hot PCE confirmed that trajectory. By Friday June 26, roughly $1.26 billion in crypto positions were liquidated in a single session, with over $450 million in long liquidations in approximately one hour. Funding rates held near-neutral-to-negative, extending 2026’s sustained negative-funding regime. Fear & Greed sat in Extreme Fear territory, reading 16–17 by the weekend.
Two additional forces amplified the move. The SpaceX IPO, priced at approximately $135 per share against a roughly $1.75 trillion valuation, drained liquidity as capital rotated out of crypto to participate in the record raise. Simultaneously, the CLARITY Act’s prospects dimmed after bipartisan Senate talks reportedly collapsed ahead of its July 4 target, removing a regulatory tailwind that had been supporting risk appetite. The combination delivered a risk-off week with clear conviction.
The week’s lone offsetting signal was geopolitical: a US–Iran ceasefire and Strait of Hormuz reopening hopes pushed oil lower, easing energy-driven inflation fears at the margin. It was not enough to reverse the broader posture, but it prevented further escalation from layering onto an already stressed tape.
3. ASSET DEEP DIVE
Ethereum (ETH) Dominance
Open: 9.54% / Close: 9.26% / WoW Change: −2.94%
The Structure
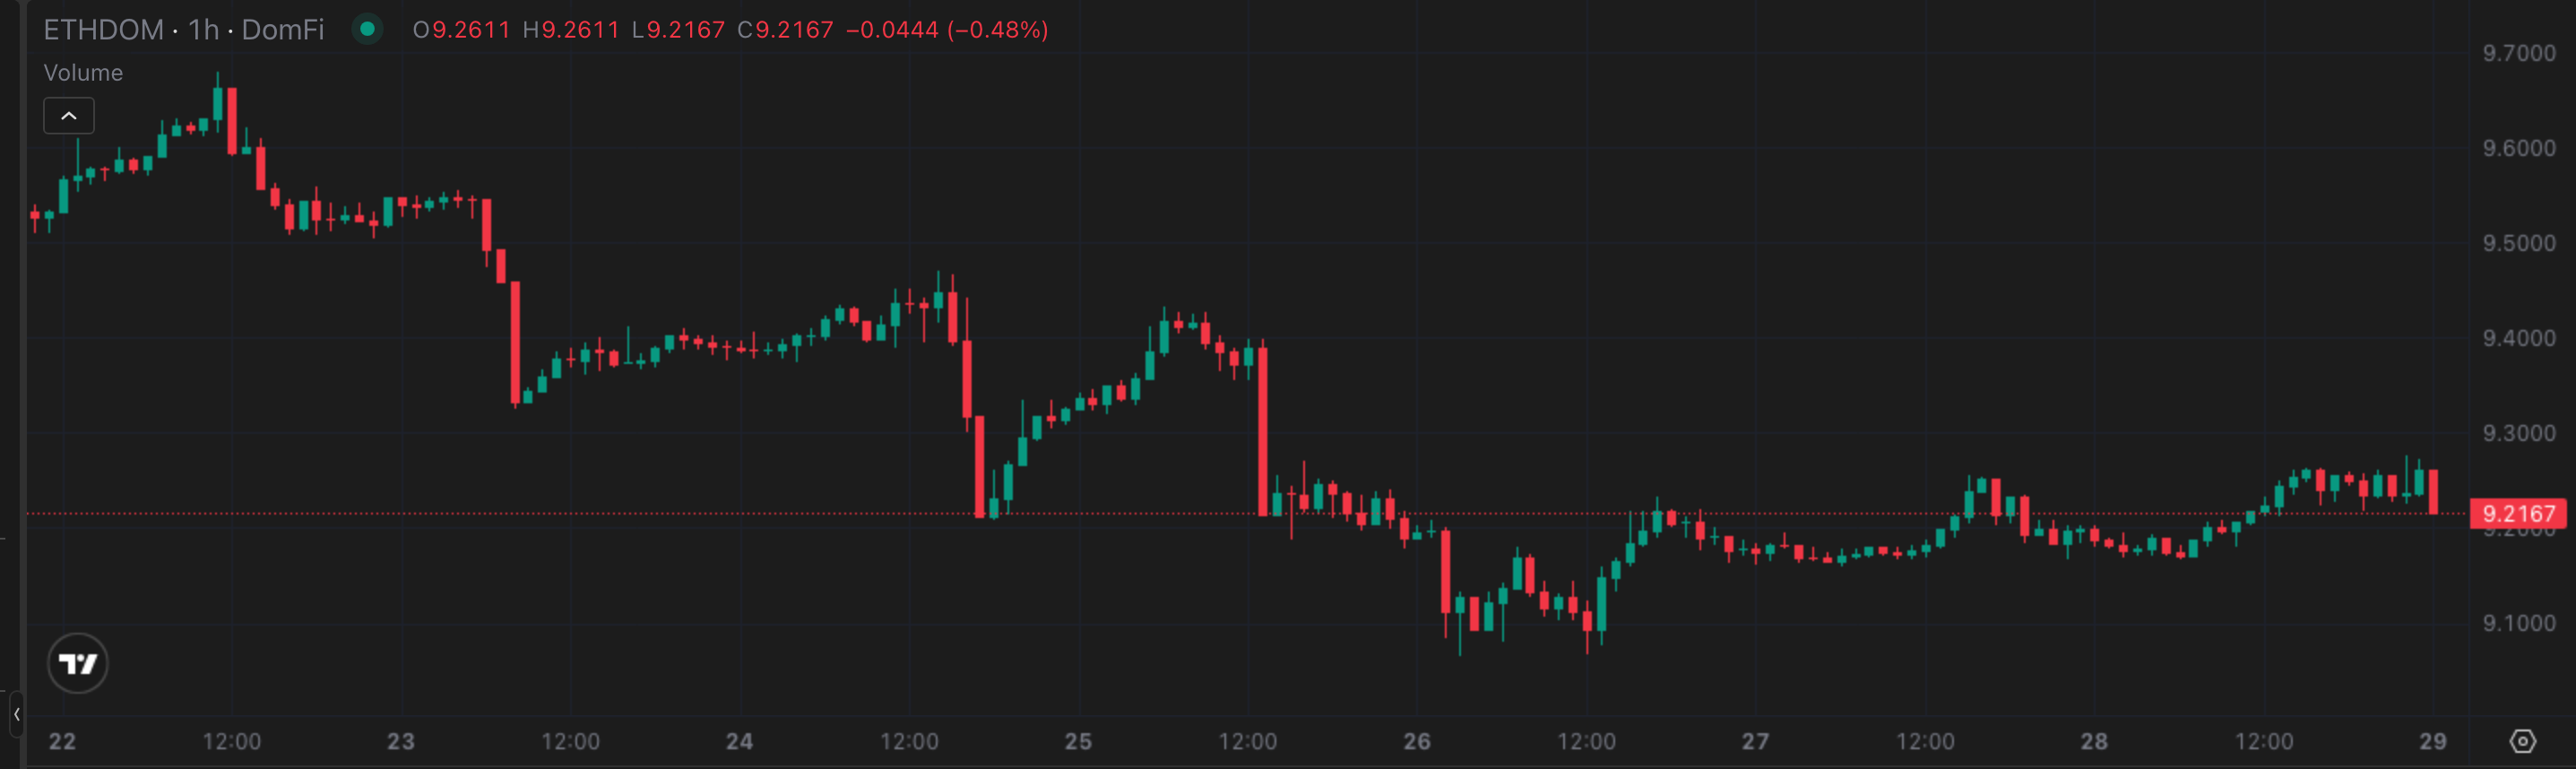
Ethereum Dominance has been in a steady structural downtrend since early April, sliding from roughly 10.90% in early April to 10.80% on May 1, then 9.79% at the start of June, 9.35% by mid-June, and into this week’s 9.54% open. The 9.26% close lands fractionally below the 9.35% mid-June reading, confirming that the descent resumed after last week’s brief bounce rather than marking some dramatic new floor. The 9.06% intraweek low is where selling pressure momentarily paused. The trend has produced successively lower lows for two months, and this week simply extended it. The ETH/BTC ratio, sitting near a 10-month low, corroborates the read independently.
This Week’s Price Action
ETHDOM opened the week at 9.54%, tagging a high of 9.68% early before the PCE shock reversed direction sharply. The intraweek low of 9.06% was reached during Friday’s liquidation cascade. ETHDOM then partially recovered into the close at 9.26%, producing a 6.84% intraweek swing on a pair that had entered the week looking like it might finally stabilize. The prior week had seen Ethereum Dominance gain +1.93% to 9.53% on relative resilience, a brief defensive bid. This week that bid evaporated completely.
The Daily View
The week played out in two clear phases. The first half, Monday through Wednesday, saw ETHDOM oscillate in a tight band around its open and the 9.68% high, as crypto held together tentatively while the market waited on macro data. The Thursday PCE print broke that consolidation. ETHDOM moved to its intraweek floor on Friday as liquidations accelerated and ETH fell harder than any other major. Into the weekend, partial stabilization emerged, though the close at 9.26% represents a net loss that more than erased the prior week’s recovery.
The Why
Two forces pressured Ethereum Dominance lower simultaneously. First, ETH’s own price fell −7.86%, meaningfully worse than the market’s roughly 5% contraction, which means ETH’s value shrank faster than the total pool it competes within. Second, ETH-specific capital departed through institutional channels: spot ETH ETF outflows continued for a seventh consecutive session, with BlackRock’s ETHA leading the losses, signaling institutional sellers were the marginal force. Layered on top, the Glamsterdam upgrade was pushed from H1 to H2 2026, removing a near-term catalyst that had been a partial support for sentiment. ETH served as the week’s primary funding source, with capital rotating into cash, which amplified USDTDOM’s move, and into Solana, which amplified SOLDOM’s.
The Outlook
Ethereum Dominance has shown no durable support through this two-month decline, and the close sits at the lower edge of that range. The two-driver problem, price weakness plus ETF outflows, needs to resolve on both fronts for any stabilization to hold. A soft Nonfarm Payrolls print on July 2 could revive rate-cut expectations and give ETHDOM room to reclaim toward the 9.54% open. Without that macro catalyst, the default trajectory keeps pressure on Ethereum Dominance.
4. THE DOMINANCE MATRIX
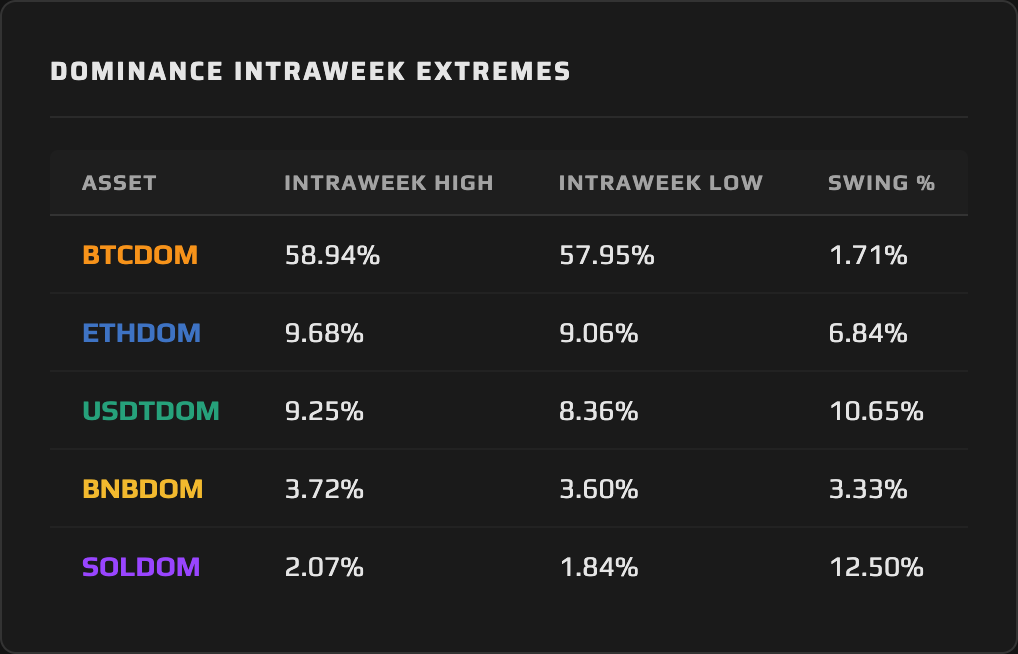
The two gainers this week operated through opposite mechanisms, which makes their simultaneous strength analytically significant.
Tether Dominance surged +5.46% from 8.61% to 9.08%, the week’s largest move by a considerable margin. The driver was not fresh stablecoin minting: aggregate stablecoin market cap ran roughly flat, from approximately $313.4 billion to $311.4 billion across the week. Instead, a contracting total market with stablecoin value sitting still mechanically lifted USDTDOM. The 10.65% intraweek swing, from an 8.36% low to a 9.25% high, reflects the compression and partial release of that fear premium. Tether Dominance cleared the prior week’s peak of 8.62% decisively, and 9.08% now stands as the new benchmark for elevated risk-off positioning. Within the stablecoin complex, the rotation of trust between USDT and competing stablecoins during a stress week is a dominance story within the dominance story; the dominance lens surfaces those intra-category dynamics precisely where they matter most.
Solana Dominance rose +3.59% from 1.95% to 2.02%, clearing the round 2.00% level the prior week had flagged as the next milestone after SOLDOM reclaimed 1.90%. This is the third consecutive week of Solana Dominance strengthening. SOL fell only −1.49% against the market’s roughly 5% contraction, gaining share by holding value better than peers. Narrative catalysts reinforced that relative strength: MoneyGram joined Solana as an infrastructure partner and validator on June 22; Solana crossed 100 billion lifetime transactions on June 26; and the Alpenglow upgrade targeting Q3 sits as the roadmap catalyst underneath. Spot SOL ETFs saw a small net outflow on June 26, which means this move was catalyst and narrative-driven from an oversold base, not fresh ETF inflows. SOLDOM’s 12.50% intraweek swing, from a 1.84% low to a 2.07% high, was the widest on the board; the 1.84% low held, matching the prior week’s floor and underscoring that level as meaningful support.
Bitcoin Dominance fell −0.75% from 58.73% to 58.29%. BTC fell −5.88%, roughly in line with the market, so the share loss was minimal. The analytically loud signal is what BTCDOM did not do: in a week of genuine risk-off stress, Bitcoin Dominance failed to absorb a safety bid. Capital that fled risk rotated into cash, not into BTC. BTCDOM produced the tightest intraweek swing on the board at 1.71%, from a 57.95% low to a 58.94% high, which underscores the absence of directional conviction either way. Bitcoin tracked the market this week; it did not lead it.
BNB Dominance fell −0.55% from 3.64% to 3.62%, the smallest move across the board. BNB fell −5.70%, closely mirroring the market’s pace, so share barely shifted. The contextually notable reversal: the prior week BNBDOM was the heaviest faller; this week it is the most contained decliner. BNBDOM’s 3.33% intraweek swing, from a 3.60% low to a 3.72% high, reflects a pair tracking macro conditions with no idiosyncratic catalyst in either direction.
Synthesis: This was a risk-off-to-cash week with a sharp intra-risk rotation running underneath. ETHDOM was the single asset sold harder than the market, funding both the flight to USDTDOM and the rotation into SOLDOM. BTCDOM and BNBDOM tracked the tape. The regime flips risk-on when BTCDOM gains while USDTDOM contracts. That has not happened.
5. THE WEEK AHEAD — EVENTS CALENDAR
Monday, June 29 — Dallas Fed Manufacturing Index, June (Prior: 0.4)
Tuesday, June 30 — JOLTS Job Openings, May (Consensus: 7.28M | Prior: 7.6M) | CB Consumer Confidence, June (Prior: 93.1) | Chicago PMI, June (Prior: 62.7) | S&P/Case-Shiller 20-City Home Price Index, April (Prior: +0.8% YoY)
Wednesday, July 1 — ISM Manufacturing PMI, June (Consensus: 53.0 | Prior: 54.0) | ADP Employment Change, June (Consensus: +125K | Prior: +122K) | Construction Spending, May (Prior: +0.4% MoM) | Eurozone HICP Flash, June (Prior: 3.2% YoY)
Thursday, July 2 — Nonfarm Payrolls, June (Consensus: +115K | Prior: +172K) | Unemployment Rate (Consensus: 4.3% | Prior: 4.3%) | Average Hourly Earnings (Consensus: +0.3% MoM | Prior: +0.3%) | Initial Jobless Claims (Prior: 215K) | Factory Orders, May (Prior: +4.8% MoM) | US bond market early close, 2:00 PM ET
Friday, July 3 — US equity and bond markets closed (Independence Day observed) | Cardano van Rossem hard fork governance ratification
Saturday, July 4 — CLARITY Act July 4 target: deadline for US Senate passage of the crypto market-structure bill
Sunday, July 5 — Ethena (ENA) token unlock: 171.88M ENA (~2.82% of circulating supply)
What to Watch for Dominance: Thursday’s Nonfarm Payrolls, pulled forward to July 2 by the holiday, is the pivot. A strong print confirms higher-for-longer and extends the flight to cash, pressing USDTDOM above 9.08% toward its 9.25% intraweek high while ETHDOM stays pinned near its 9.06% low; a weak print revives rate-cut expectations and gives Ethereum Dominance room to reclaim toward the 9.54% open. SOLDOM’s hold of 2.00% is the tell for whether the SOL rotation survives a macro reset.
6. CLOSING REMARK
The week of June 22 resolved a question that has been building since April: where does crypto’s safety bid go when real fear arrives? The answer came Thursday with the PCE print. It went to cash. Tether Dominance absorbed the demand that, in a prior risk cycle, might have gone to Bitcoin. BTCDOM’s 1.71% intraweek swing in a week of billion-dollar liquidations is the quiet tell. The market is not treating BTC as the risk-off refuge; it is treating stablecoins that way. That is a regime read with consequences for every pair on the dominance charts.
The intra-risk rotation is equally instructive. Solana Dominance is in its third consecutive week of gains, now above 2.00%, while Ethereum Dominance has given back the prior week’s bounce and resumed its slide. These are not random fluctuations. Capital has clear preferences, and right now within the risk-on stack, those preferences run toward Solana and away from ETH. Until Glamsterdam ships, until institutional ETF flows reverse, and until a macro catalyst softens the Fed’s stance, Ethereum Dominance faces the same two-driver headwind it dealt with this week. The dominance charts will register the turn when it comes.
This content is produced by domination.finance for informational and educational purposes only. Nothing contained herein constitutes financial or investment advice. Always conduct your own research.